Download
1 / 33
330 likes | 397 Views
Tropical Cloud Systems [In the ‘tradition’ of GCSS Plenary talks, a broad and misleading title]. Ed Zipser University of Utah. Acknowledgements. Research Associates: • Chuntao Liu (U of Utah); Baike Xi (U of Utah, now UND) Current and Former Students:

E N D
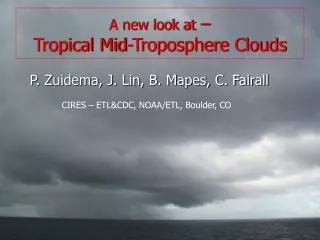
Tropical Cloud Systems[In the ‘tradition’ of GCSS Plenary talks, a broad and misleading title] Ed Zipser University of Utah
Acknowledgements Research Associates: • Chuntao Liu (U of Utah); Baike Xi (U of Utah, now UND) Current and Former Students: • Haiyan Jiang (U of Utah, now GSFC/UMBC) • Yaping Li (U of Utah) • Steve Nesbitt (Texas A&M and U of Utah, now CSU), • Dave Yorty (U of Utah, now modifying the weather) • Dan Cecil (Texas A&M, now NASA MSFC/UAH) • Rick Toracinta (Texas A&M, now Ohio State U) • Karen Mohr, Chris Lucas, Brad Ferrier, Gary McGaughey, Robbie Hood, Gerry Heymsfield, +participants in numerous field programs TRMM Program Scientists: Joanne Simpson, Chris Kummerow, Bob Adler Erich Stocker and TSDIS Funding mostly NASA TRMM Science, also NASA CRYSTAL-FACE, NASA Earth System Science Fellowships
Precipitation Features What is a precipitation feature? Contiguous area at least 4 pixels in size (75 km2) with: PR “near surface” reflectivity ≥ 20 dBZ (identify near surface rain) or TMI 85 GHz PCT ≤ 250 K (identify anvils and be consistent with previous work using the SSM/I, e.g. Mohr and Zipser 1996)
The TRMM Database (5 yr; 12M PFs)can be used as observational validation of properties of rain-producing systems • Where are the MCSs and how much rain do they contribute? • Where do small PFs contribute most? :Large PFs? • How much rain is contributed by PFs reaching 12 km? 15 km? Where? • How much rain is contributed by PFs containing lightning? • How much rain falls from mesoscale PFs with strong convection? • How much rain falls from mesoscale PFs without strong convection? • What is the convective vs. stratiform partitioning of rain and how does it vary around the globe? • [….and how well do GCMs do answering these questions….?]
Fractional rain (%) contributed by large MPFs vs. small PFs Very large Small
Fractional rain (%) contributed by PFs with specified properties
Fractional rain (%) contributed by MPFs with 40 dBZ height </> 6 km
Fractional rain (%) contributed by MPFs with convective fraction </> 50%
Proxies for Convective Intensity • Lowest IR brightness temperature - gives indication of cloud top height but poorly related to convective vertical velocity- might even be only thin cirrus • Highest altitude with >20 dBZ radar echo - good • Highest altitude with >40 dBZ radar echo - better • Lightning flash rate - generally good(but indirect and also may be related to aerosol properties of environment) • Lowest brightness temperature at 85 GHz or 37 GHz - good How good? Which are best? Next slides show global distribution of proxies for convective vertical velocity
CDF of PFs by flash rate Green: > 2/minute Orange: > 30/minute Purple: > 120/minute Black triangle: > 300/minute Each color step signifies that the event is 10 X rarer! Logarithmic color scale by rarity of event (i.e., black 10 X rarer than purple, purple 10 X rarer than orange, etc. (Cecil et al)
Why does convective vertical velocity matter? • It matters a great deal in the microphysics of the mixed phase region • Weak updrafts => low graupel mixing ratios, absence of large graupel, little electrification, low dBZ aloft • Rain over tropical oceans comes from weak updrafts….. • Really strong updrafts (undilute, adiabatic cores) may exhaust huge numbers of small ice crystals, with huge ice water content, at and above the tropopause
Data from land Data from oceans
20°N-20°S Intensity Proxies: Deep tropics--no influence of intense subtropical systems Total rainfall is not closely related to flash rate or other intensity proxies (but it is, of course, closely related to convective mass flux)
Challenge • Challenge to modelers: Can we simulate convective intensity as well as rainfall? • Opportunity: Seven years of TRMM observables are now available. Why not use them to evaluate models? • Example: Distribution of overshooting radar tops
Overshooting PFs are defined using 5 different reference heights (I): Constant 14 km (Alcala and Dessler, 2002) (II): Potential temperature > 380 K (III): NCEP reanalysis tropopause height (IV): Level of Neutral Buoyancy (LNB) from NCEP sounding (using e surface) (V): Level of Neutral Buoyancy (LNB) from NCEP reanalysis (using maximum of e 925mb and e 1000mb) (Tropopause height and LNB for each one of 5 million PFs in 5 years are interpolated from 2.5o x2.5o, 6 hour interval NCEP reanalysis data.)
Location of overshooting towers(total # of PFs with 4 pixels between 20N-20S in 5 years: 5,208,813) Overshoot distance > 2km (blue) >3km (red)
Diurnal variation of overshooting tower occurrence Land Ocean
Overshooting area distribution from 5 reference heights 14km =380k Tropopause LNB (e 925&1000mb) LNB (e surface)
Summary • TRMM database is now 7+ years and may be as valuable for convective properties as for rainfall • The longer TRMM stays in orbit, the more valuable the statistics become; e.g., more stable diurnal cycles, more sampling of rare events, … • All proxies for convective intensity [w] show land much stronger than ocean, with intriguing regional differences • Why are equatorial Africa storms stronger than Amazon storms? • Stratospheric penetration of convection is greatest over Africa. Why? Significance for transport of (name it!)?
Time-height maximum radar reflectivity and vertical velocity Time-height maximum radar reflectivity and vertical velocity Kwajalein MCS of11-12 Aug. 1999 Max reflectivity dBZ Max upward speed m/s
Kwajalein MCS of11-12 Aug. 1999 Max reflectivity from Rain Water Time-height maximum radar reflectivity Max reflectivity dBZ From Snow From Graupel Graupel is major contributor of reflectivity in the ice region
Time-height maximum graupel mixing ratio and vertical velocity Kwajalein MCS of11-12 Aug. 1999 Max Graupel mixing ratio g/kg Max upward speed m/s
Comparison of the simulated results with actual observations Comparison of the simulated results with actual observations Maximum height of Kwajalein MCS of 11-12 August 1999 Research radar observations 20 dBZ 40 dBZ Storm total CFADs of convective region reflectivity (From Yuter et al. 2005)
Comparison of simulated & actual TRMM observation statistics Comparison of the simulated with the actual TRMM observation statistics Maximum reflectivity at Minimum PCT of 6 km 85 GHz 37 GHz 9 km