Download
1 / 23
230 likes | 442 Views
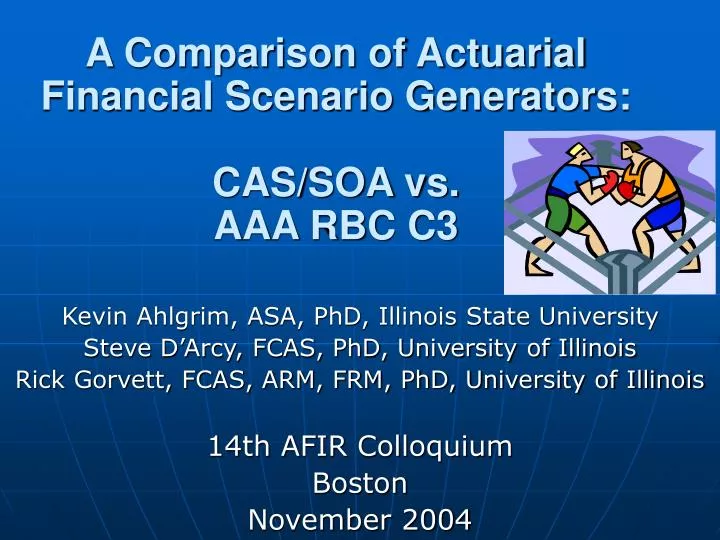
A Comparison of Actuarial Financial Scenario Generators: CAS/SOA vs. AAA RBC C3. Kevin Ahlgrim, ASA, PhD, Illinois State University Steve D’Arcy, FCAS, PhD, University of Illinois Rick Gorvett, FCAS, ARM, FRM, PhD, University of Illinois 14th AFIR Colloquium Boston November 2004.

E N D
A Comparison of Actuarial Financial Scenario Generators:CAS/SOA vs.AAA RBC C3 Kevin Ahlgrim, ASA, PhD, Illinois State University Steve D’Arcy, FCAS, PhD, University of Illinois Rick Gorvett, FCAS, ARM, FRM, PhD, University of Illinois 14th AFIR Colloquium Boston November 2004
Outline of Presentation • Motivation for Financial Scenario Generators • Description of economic variables • Structure of each model • Comparison of output • Conclusion
CAS/SOA Motivation • Provide public access model for use in • DFA • Regulatory • Rating agency • Internal management tests • Conduct literature review • From finance, economics, and actuarial science • Develop financial scenario generator model • Generate scenarios over a 50 year time horizon • Facilitate use of model http://casact.org/research/econ/
CAS/SOA Relationships Among Modeled Economic Series Inflation Real Interest Rates Unemployment Nominal Interest Real Estate Stock Dividends Lg. Stock Returns Sm. Stock Returns
CAS/SOA Inflation (q) • Modeled as an Ornstein-Uhlenbeck process • One-factor, mean-reverting dqt = kq(mq – qt) dt + sq dBq
CAS/SOA Real Interest Rates (r) • Two-factor Vasicek term structure model • Short-term rate (r) and long-term mean (l) are both stochastic variables drt = kr (lt – rt) dt + sr dBr dlt = kl (ml – lt) dt + sl dBl
CAS/SOA Nominal Interest Rates • Combines inflation and real interest rates i = {(1+q) x (1+r)} - 1 where i = nominal interest rate q = inflation r = real interest rate • Restriction against negative interest rates
AAA Motivation • Provide guidance for setting Risk-Based Capital (RBC) requirements for variable products with guarantees • Focus is on • Interest rate risk • Equity risk • Recommend use of models • Also provide 10,000 Pre-packaged scenarios • Available at: http://www.actuary.org/life/phase2.htm
AAA Relationships Among Modeled Economic Series 10-year U.S. Treasury yields 3-month U.S. Treasury yields U.S. Long Term Corporate Bonds U.S. Intermediate Term Government Bonds 7-year U.S. Treasury yields Money Market Diversified Fixed Income Diversified U.S. Equity Diversified International Equity Risk-free rate r = 5.5% (effective) for all markets, roughly equal to the average 6-month U.S. Treasury yield over the past 50 years Diversified Balanced Intermediate Risk Equity Aggressive or Specialized Equity
AAA Nominal Interest Rates Three Processes For Three Time Scales • Long term, 10-Year Treasury Yield • Short term, 3-Month Treasury Yield • Medium-term, 7 year Treasury Yield
AAA Properties of the Interest Rate Model • Where • Z1, Z2, Z3 are normal distributions with mean 0; • α, Φ are mean-reversion strengths; • λ, τ, ξt are regression parameters. • Lognormal distribution at time t • Avoid negative nominal interest rates. • Make the Kurtosis positive all the time • Funnel of Doubt Graphs shift to the upper side. • Variance increases faster as t increases
CAS/SOA AAA RBC C3 f (t, i) f (t, i) i i 0 0 t t
Funnel of Doubt Graphs3 Month Nominal Interest Rates (U. S. Treasury Bills)
Histogram of 3 Month Nominal Interest RatesModel Values and Actual Data (01/34-05-04)
Funnel of Doubt Graphs 10 Year Nominal Interest Rates (U. S. Treasury Bonds)
Histogram of 10 Year Nominal Interest RatesModel Values and Actual Data (04/53-05/04)
CAS/SOA AAA Equity Returns • Both models use Regime Switching Lognormal Model with monthly data and 2 regimes (RSLN2) • Model equity returns as an excess return (xt) over the nominal interest rate st = it + xt • Two Regimes • High return, low volatility regime • Low return, high volatility regime • Six parametersμ1, σ1; μ2, σ2; P12, P21 Within Volatility Regimes μ1, σ1; μ2, σ2 Transition Matrix
Parameter Differences • Data Sources for Maximum likelihood estimates • Parameter Differences (AAA Pre-packaged scenarios)
Histogram of Large Stock ReturnModel Values and Actual Data (1872-2004)
Funnel of Doubt Graphs Small Stock Return (Intermediate Risk Equity)
Histogram of Small Stock ReturnModel Values and Actual Data (1926-2003)
Conclusion • Financial models are assuming greater importance for actuaries • Actuaries need to understand how to apply these models • CAS/SOA model generates greater variance • AAA RBC C3 model provides returns on more types of investments • Try out these models • Suggest additions or improvements • Questions?