Download
1 / 12
120 likes | 270 Views
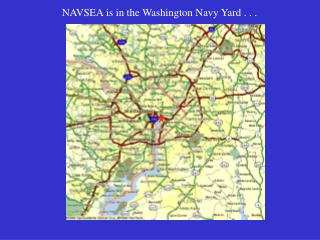
The Navy Yard The Campus. The Energy. The Opportunity. 2013 master plan updated Districts. 2004 Master Plan. Navy Expansion. Port. Buffer. The unregulated Navy Yard Grid. 19MW. 15MW. The navy yard grid - Today. 13.3 kV/2300 V Primary 29 MW Peak Demand 34 MW Capacity

E N D
The Navy Yard The Campus. The Energy. The Opportunity.
2013 master plan updated Districts 2004 Master Plan Navy Expansion Port Buffer
The unregulated Navy Yard Grid 19MW 15MW
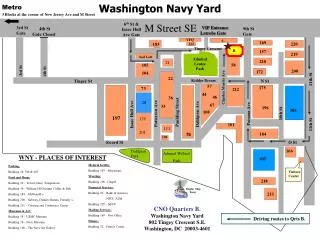
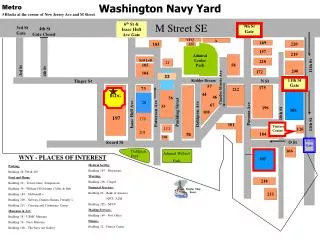
The navy yard grid - Today • 13.3 kV/2300 V Primary • 29 MW Peak Demand • 34 MW Capacity • Two primary substations - 15 MW & 19 MW • 100 miles of Distribution Feeders – Subsurface • 164 Transformers • No NOC or SCADA • 65 Customers (8 Customers - 88% Usage) • 182 Revenue Meters – 3 Tier Tariff • 96% External Sourced Supply • On-site Generation – 600 kW Fuel Cell
Energy Master Plan TEAM Technical Advisor:
Scenario b: Demand mitigation Business as Usual – 100% Utility Fed • All PECO supply • No On-site generation (DG) • No proactive EE or DR effort Utility Demand - 82 MW On-Site DG Grid Programs: • Natural gas DG • 6 MW Peak Reduction • 3 MW CHP (data center) • 1 MW Solar PV • 600 KW Fuel Cell Utility Demand - 72 MW Demand Response & Energy Efficiency Customer programs: • 20% EE goal by 2022 • Navy DOD mandates • B-T-M Demand Reduction Utility Demand - 60 MW Cumulative usage decrease – over 61,000 MWh
TNYEMP Implementation 2013 - 2014 Burns/Alstom/PECO • 10 MW New Capacity for LDC (PECO) • New 15 MW West Entrance Substation Design (Burns) • Functional Definition – Business Requirement Analysis (Alstom) • AMI Design, Specification, Vendor Identification (Alstom) • Meters • Communications • Field network • Backbone • Infrastructure • NOC • Operations/Business Data Model • Time Series Data Base/Historian • MDM 3 Lines 15 MW 3 Lines 15 MW 3 Lines 15 MW
GridSTAR - Plug & Play Microgrid PIDC Building – BEMS/DR EVC - (V2G) Net Zero Bldg–ES/SPV/B2G SPV Training Center AMI Solar PV installation Grid-interactive ES 1 2 7 3 5 6 4
Energy Master Plan – Analysis of Viable Scenario Alternatives 12/12 12/13 12/14 12/15 12/16 12/17 12/18 12/19 12/20 12/21 12/22
Will Agate, SVP, The Navy Yard PIDC www.navyyard.org /TheNavyYard @NavyYardPhila