Download
1 / 9

E N D
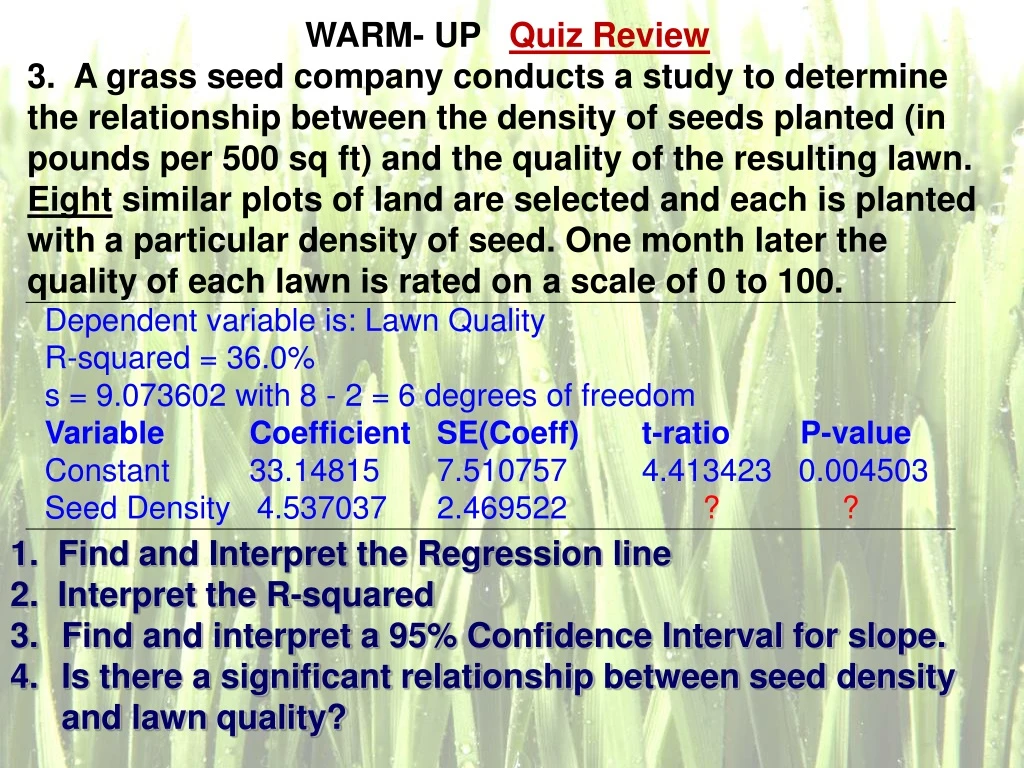
WARM- UP Quiz Review 3. A grass seed company conducts a study to determine the relationship between the density of seeds planted (in pounds per 500 sq ft) and the quality of the resulting lawn. Eight similar plots of land are selected and each is planted with a particular density of seed. One month later the quality of each lawn is rated on a scale of 0 to 100. Dependent variable is: Lawn Quality R-squared = 36.0% s = 9.073602 with 8 - 2 = 6 degrees of freedom Variable Coefficient SE(Coeff) t-ratio P-value Constant 33.14815 7.510757 4.413423 0.004503 Seed Density 4.537037 2.469522 ? ? • 1. Find and Interpret the Regression line • 2. Interpret the R-squared • Find and interpret a 95% Confidence Interval for slope. • Is there a significant relationship between seed density and lawn quality?
Dependent variable is: Lawn Quality R-squared = 36.0% s = 9.073602 with 8 - 2 = 6 degrees of freedom Variable Coefficient SE(Coeff) t-ratio P-value Constant 33.14815 7.510757 4.413423 0.004503 Seed Density 4.537037 2.469522 ? ? • Find and Interpret the Regression line • Predicted Lawn Quality = 33.1482 + 4.5370(Seed Density) • For every additional lbs./500ft2of seeds, Predicted Lawn Quality improves 4.54% on average. • A Lawn with 0 seeds will be rated at 33.1%. • 2. Interpret the R-squared • 36% of the variation in Predicted Lawn quality is due to seed density.
Dependent variable is: Lawn Quality R-squared = 36.0% s = 9.073602 with 8 - 2 = 6 degrees of freedom Variable Coefficient SE(Coeff) t-ratio P-value Constant 33.14815 7.510757 4.413423 0.004503 Seed Density 4.537037 2.469522 ? ? 3. Find and interpret a 95% Confidence Interval for slope. We can be 95% confident that for every increase in seed density the lawn quality is predicted to increase - 1.5059 and 10.5799 . We can be 95% confident that the true slope of seed density vs. lawn quality is between -1.5059 and 10.5799 .
Dependent variable is: Lawn Quality R-squared = 36.0% s = 9.073602 with 8 - 2 = 6 degrees of freedom Variable Coefficient SE(Coeff) t-ratio P-value Constant 33.14815 7.510757 4.413423 0.004503 Seed Density 4.537037 2.469522 ? ? 1.8372 0.1158 4. Is there a significant relationship between seed density and lawn quality? Since 0.1158>0.05, we fail to reject H0. There is NOT sufficient evidence of a significant relationship b/w S.D. and L.Q.
WARM – UP Is the height (in inches) of a man related to his I.Q.? The regression analysis from a sample of 26 men is shown. (Assume the assumptions for inference were satisfied.) Dependent variable is: IQ R-squared = 47.3% s = 6.3158 Variable Coefficient SE(Coeff) Constant 1.1836 3.2184 Height 1.4492 0.8827 • Find and interpret slope and y-int. for the Regression Line. • For every additional inch of height a mans IQ will increase 1.4492 points. A man 0 inches high will have an IQ of 1.18 • 2. Is there an association b/t height and IQ in men? • Write the Hypothesis, t & p-values, and conclusion.
Dependent variable is: IQ R-squared = 47.3% s = 6.3158 Variable Coefficient SE(Coeff) Constant 1.1836 3.2184 Height 1.4492 0.8827 n = 26 t-ratio P-Value 1.6418 t-ratio P-Value 1.6418 t-ratio P-Value 1.6418 0.1137 2. Is there an association b/t height and IQ in men? Write the Hypothesis, t & p-values, and conclusion. Since the p-value of .1137 is above 0.05, we cannot reject H0. In conclusion there is NO Evidence of a significant relationship b/w IQ and height.
Regression InferenceC.I. • To estimate the rate of change, slope, we use a Confidence Interval. The formula for a confidence interval for 1 is: Find the t* for a 99% Confidence Interval with n = 20 t* = 2.878
WARM – UP • What was the Rate of Improvement from the Quiz to the Test . Dependent Variable is: Test R-squared = 35.3% s = 4.866 with 8 – 2 = 6 degrees of freedom Variable Coefficient SE(Coeff) T-ratio P-Value Intercept 64.2170 14.204 1.6249 0.1386 Quiz 0.36137 0.19985 1.8082 0.1206 We can be 95% confident that for every additional point increase in quiz grade your test grade is predicted to be - 0.1276 and 0.8504 higher.