Download
1 / 33
330 likes | 465 Views
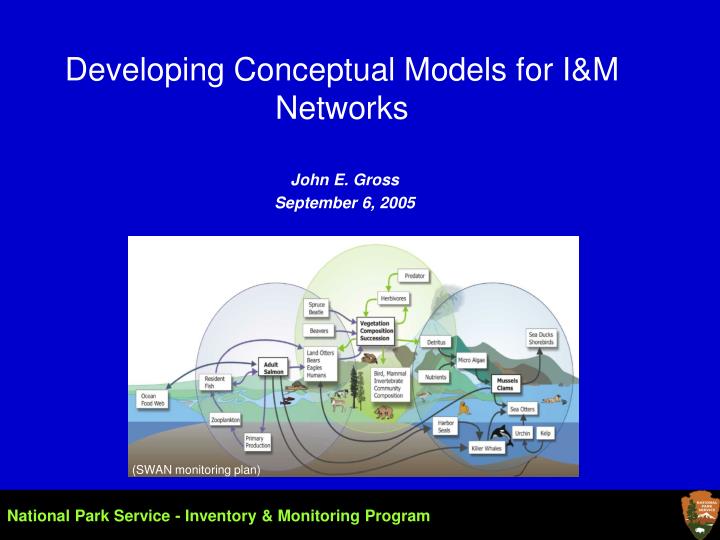
Developing Conceptual Models for I&M Networks. John E. Gross September 6, 2005. (SWAN monitoring plan). National Park Service - Inventory & Monitoring Program. Roadmap. Key background Examples – Who/what are the models for? Strategy for getting to the finish line – good, fast, and cheap

E N D
Developing Conceptual Models for I&M Networks John E. Gross September 6, 2005 (SWAN monitoring plan) National Park Service - Inventory & Monitoring Program
Roadmap • Key background • Examples – Who/what are the models for? • Strategy for getting to the finish line – good, fast, and cheap • Resources
Uses of conceptual models vary with network maturity Phase 1 Communicate understanding about ecosystem: What are the major ecosystems?What do we know about them? What do we need to know? Ensure selected VS are integrative, comprehensive Communicate why / how VS are informative and important Inform sampling design; communication about program Facilitate integration and synthesis of data: understanding and reporting. Phase 2 Phase 3 Implemented
Vanni et al. February 2005. Bioscience 55(2):155-167 Well designed and executed diagrams will be useful at all stages, from selecting VS to future publications of results. Conceptual models frequently appear in the top ecological journals.
Refer to the monitoring plan checklist – chapter 2 & appendices. These are the criteria that reviews will use to evaluate the models.
What you’ll likely to end up with: • A highly aggregated, holistic model (e.g., Jenny-Chapin), • mechanistic (process, control, etc.) models of key ecosystems, processes, and perhaps species, • some state-and-transition models (fire, grazing, invasive plants), • driver-stressor models focused on priority vital signs (maybe), • tables with important drivers, responses, resources, etc., • detailed narratives, • currently (September 05), several networks are developing conceptual diagrams for each park in the network. These park-specific models have been very well received by park staff. Select the model structure for the purpose. Don’t attempt to use a ‘one size fits all’ philosophy
A few observations … • Construct need-specific models rather than monolithic structures • Hierarchically structured sets of models have advantages • holistic model provides regional/global context • systematic means to added detail as needed, • makes linkages between model obvious, • Craft is important. Rushing the final step is like letting a child finish fine furniture.
Who and what are the models for? • Audiences: • Network staff (there will be turnover) • Park staff – interpreters, resource specialists, superintendents, operations staff, EPMTs, etc • Science partners / collaborators / researchers • Network committees – science, technical, boards • For NEPA, EIA/EIS, project reviews • GMP / RSPs - DFC • WASO Monitoring Plan reviewers
Some key information the models need to communicate NCPN modifications to Chapin model by Mark Miller (USGS) What are the overarching, broad-scale constraints and system drivers?
What do the models need to communicate? General characteristics of ecosystems Photographs are information-rich. Use them wisely. (SECN revised Phase 1) (IAN Newsletter 5: www.ian.umces.edu) (Mutel and Emerick 1992)
General system characteristics (SECN revised Phase 1 report)
Major environmental gradients are often clear on maps. Nationwide weather gradients are available via PRISM data. (Hevesi et al. 2003)
Some models should communicate our understanding of system dynamics. How do you expect the system to change over time in response to (fire, grazing, climate, restoration, etc)? How can we manage lands to achieve a desired future condition if we don’t understand system dynamics? (Knight 1992)
An aggregate, simple model can be used to put more detailed submodels in context. Here’s the broad-scale view of the hydrological cycle. The next slide is a more detailed consideration of water flow. (from http://cires.colorado.edu/limnology/)
A good process model can clearly communicate key links between ecosystem processes and attributes that, together, strongly determine system drivers and responses. Herrick’s model – SCPN Phase 1
What don’t we know? Where are the most important gaps in our understanding? Climate ? Forest insect and disease (Blister Rust, Pine Beetles) Atmospheric Deposition Fire ? Landbirds (Clark’s Nutcracker) WHITEBARK PINE Large Carnivores (Grizzly Bear) GRYN Whitebark pine model
Forested Watersheds Agricultural Watersheds (Walters et al. 2000) (Vanni et al. 2005) Emphasize the important parts Use line weights, colors, shapes, etc. But don’t go overboard.
What key factor(s) are primarily responsible for the system we observe? Fuel load: trees & grass biomass, weather Ponderosa pine control model This model is structurally correct Seed production / persistence (pollination, granivory, decay, etc) Seed bank Seedlings (#/ha) Saplings (#/ha) Snags (#/ha) Trees (#ha) Survival and growth Survival rate Survival and growth Decay, combustion Fire extent Fire intensity Grazing, thinning Fuel continuity(stand) Fuel continuity(landscape) Fire submodel Fire frequency: (suppression, prescribed burning, lightning) (Gross, unpublished)
Spawning Hydrograph Season-dependent: Spring = runoff Summer/fall = base Connectivity CFS Nesting CFS Time Snow Glacial/base Sediment transport CFS Channel and Floodplain Morphology (connectivity) Flow dynamics: floods, base flow Riparian habitats Sediment Transport and Storage Hyporheic flow In-channel CFS Bull trout Water temperature Reproductive success Temperature Hyporheic flow Glaciers Snow pack What are the important interactions between system components, and HOW do they affect system dynamics? Landscape: Fire, veg. cover, soil properties Precipitation Runoff rate Temperature In-channel flow Surface flow In-channel flow Hyporheic flow Ground Water Water temperature Nutrient content ROMN-GLAC model
A conceptual model of the Bremer River ecosystem has been developed that is suitable for (1) developing a coherent overview of relevant ecological and biogeochemical processes affecting water quality and also for (2) design of a relevant survey sampling program and (3) subsequent design of a numerical simulation model to test water quality improvement strategies. Figure 1: Primary water column nutrient cycles in Bremer River and inputs of phosphates, silicates, DOC, DON and inorganic nitrogen. From: http://www.coastal.crc.org.au/bremer/ecosystem_dynamics.html
A particularly nice example of a very complex, but still understandable model. http://www.coastal.crc.org.au/bremer/ecosystem_dynamics.html
Models vary in scale Model Scale What it communicates Generalized environmental model Stage-setting; global and regional scale drivers and responses Landscape-scale diagrams Environmental gradients; broad-scale drivers; linkages between systems (disturbance, land use) Ecosystem Dynamics; broad to fine scale factors Species, site, or habitat models Detailed mechanisms & feedbacks, stressors->VS
Moderately dense even or mixed-aged stand • many saplings • infrequent fire due to suppression or non-continuous ground fuel • fires likely to be intense, extensive, and stand-replacing • Desirable park-like stand • grassy understory • ~ 100 trees/ac • frequent “cool” ground fires • fires extensive and patchy • minimal influence by exotics Overgrazing, fire suppression Prescribed burning, thinning State and transition models – see the CPN monitoring plans and Lisa Thomas’ presentations Intense crown fires Thin and burn? • Dense even-aged stand • stand-replacing fires frequent or infrequent • understory vegetation sparse • fuel load large and continuous • fires intense and spatially extensive Ponderosa pine state and transition model
Model strengths and weaknesses • Control models • accurately represent feedbacks and interactions • usually most realistic structure • insights from construction • often complicated and hard to communicate • state dynamics may not be apparent • State and transition • clear representation of alternative states • can be simple • excellent communication with most audiences • generally lack mechanism • usually too general to directly link to vital signs • Driver-stressor models (but be careful of driver/stressor distinction) • provide clear link between agent of change and VS • simple and easy to communicate • no feedbacks • few or no mechanisms • frequently inaccurate and incomplete
A bit on the craft …it makes a BIG difference!!! Some very basic elements … • align boxes, both horizontally and vertically • emphasize key linkages by line weight, style, or colors • minimize use of colors and shapes • aggregate lines when possible • maximize ‘content ink’ • See Tufte: The visual display of quantitative information Likely a major move to using IAN toolkit or similar for conceptual diagrams, particularly for diagrams of parks
Common-Language Indicators EMAP Indicator names for forests Contamination of Forest Plants by Air Pollution Lichen chemistry Foliar chemistry Dendrochemistry Bioindicator plants - ozone Crown condition Lichen communities Photosyntheticaly active radiation - leaf area Root ecology Health of Forest Plants Branch evaluations Visible plant damage Regeneration Mortality Soil classification & physiochemistry Woodland Productivity for Forest Products Tree growth Overstory diversity Vegetation structure Dendrochronology Forest structure scenic rating Forest Aesthetics Habitat Quality for Birds and Deer Wildlife habitat Simplify where possible As published Same content, with 20 minutes of editing (Schiller et al. 2001. Cons. Ecol 5(1)19)
Lithosphere Hydrosphere Biosphere Atmosphere Cryosphere Intensive land use Extensive land use Disturbance regime Global change Values: Wilderness Viewshed Night sky Soundscape Ecosystem condition Changes in effective reserve size Ecological flows Ecosystem resilience Crucial habitat Edge effects Some aspects may be non-spatial Same content, simplied Lithosphere Hydrosphere Biosphere Atmosphere Cryosphere (from landscape workshop, January 2003) Global change Intensive land use Extensive land use Disturbance regime Ecosystem condition Values: Wilderness Viewshed Night sky Soundscape Changes in effective reserve size Ecological flows Ecosystem resilience Crucial habitat Edge effects Some aspects may be non-spatial
Mechanistically correct models: • Begin by identifying state variables (population size, N, C, etc) • Rates connect state variables • Feedbacks are from state variables to rates, not rates to rates • Consider flows of information, energy/material • Separate external drivers, sources, & sinks from internal variables • Think about functional form of relationships • Simplicity is a virtue, and a serious challenge
Contents of Chapter 2 (and/or appendix) • Introduction. Short justification, goals, and philosophy that guided model development (NCPN). • Clear table listing all models, w/ figure and page numbers (revised ROMN) • Overall description of models and chapter structure (by ecosystem, park, discipline, or ??) • Detailed narratives with pertinent, and complete, citations that closely match and that explain/embellish figures • Pertinent citations, all in the bibliography • and, of course, models that meet all the criteria in the checklist There must be a clear connection between the models and vital signs. If there’s not, are the models or VS inadequate?
Resources – Don’t reinvent the wheel Other Networks & reports – see esp. CPNs, UCBN, ROMN, SECN, GRYN Conceptual model web page: http://science.nature.nps.gov/im/monitor/ConceptualModels.htm Mike Scott – Riparian models for CPN. Great report. Landscape effects –Hansen and Gryskiewicz report Faculty at nearby colleges/universities Alpine – for start, see Niwot ridge LTER site http://culter.colorado.edu/NWT/research/research.html Simple models for various systems – GRYN Integration and Application (IAN) http://www.ian.umces.edu - symbols toolkit, handbook, professional support Maddox et al. 1999 – best single paper Call or email: John Gross, 970 267-2111, john_gross@nps.gov