Download
1 / 67
690 likes | 876 Views
GEOGG121: Methods Introduction to Bayesian analysis. Dr. Mathias (Mat) Disney UCL Geography Office: 113, Pearson Building Tel: 7670 0592 Email: mdisney@ucl.geog.ac.uk www.geog.ucl.ac.uk /~ mdisney. Lecture outline. Intro to Bayes’ Theorem Science and scientific thinking

E N D
GEOGG121: MethodsIntroduction to Bayesian analysis Dr. Mathias (Mat) Disney UCL Geography Office: 113, Pearson Building Tel: 7670 0592 Email: mdisney@ucl.geog.ac.uk www.geog.ucl.ac.uk/~mdisney
Lecture outline • Intro to Bayes’ Theorem • Science and scientific thinking • Probability & Bayes Theorem – why is it important? • Frequentists v Bayesian • Background, rationale • Methods • Advantages / disadvantages • Applications: • parameter estimation, uncertainty • Practical – basic Bayesian estimation
Reading and browsing Bayesian methods, data analysis • Gauch, H., 2002, Scientific Method in Practice, CUP. • Sivia, D. S., with Skilling, J. (2008) Data Analysis, 2nd ed., OUP, Oxford. • Shih and Kochanski (2006) Bayes Theorem teaching notes: a very nice short intro to Bayes Theorem: http://kochanski.org/gpk/teaching/0401Oxford/Bayes.pdf Computational • Press et al. (1992) Numerical Methods in C, 2nded – see http://apps.nrbook.com/c/index.html • Flake, W. G. (2000) Computational Beauty of Nature, MIT Press. • Gershenfeld, N. (2002) The Nature of Mathematical Modelling,, CUP. • Wainwright, J. and Mulligan, M. (2004) (eds) Environmental Modelling: Finding Simplicity in Complexity, John Wiley and Sons.
Reading and browsing Papers, articles, links P-values • Siegfried, T. (2010) “Odds are it’s wrong”, Science News, 107(7), http://www.sciencenews.org/view/feature/id/57091/title/Odds_Are,_Its_Wrong • Ioannidis, J. P. A. (2005) Why most published research findings are false, PLoS Medicine, 0101-0106. Bayes • Hill, R. (2004) Multiple sudden infant deaths – coincidence or beyond coincidence, Pediatric and Perinatal Epidemiology, 18, 320-326 (http://www.cse.salford.ac.uk/staff/RHill/ppe_5601.pdf) • http://betterexplained.com/articles/an-intuitive-and-short-explanation-of-bayes-theorem/ • http://yudkowsky.net/rational/bayes • http://kochanski.org/gpk/teaching/0401Oxford/Bayes.pdf
So how do we do science? • Carry out experiments? • Collect observations? • Test hypotheses (models)? • Generate “understanding”? • Objective knowledge?? • Induction? Deduction?
Induction and deduction • Deduction • Inference, by reasoning, from general to particular • E.g. Premises: i) every mammal has a heart; ii) every horse is a mammal. • Conclusion: Every horse has a heart. • Valid if the truth of premises guarantees truth of conclusions & false otherwise. • Conclusion is either true or false
Induction and deduction • Induction • Process of inferring general principles from observation of particular cases • E.g. Premise: every horse that has ever been observed has a heart • Conclusion: Every horse has a heart. • Conclusion goes beyond information present, even implicitly, in premises • Conclusions have a degree of strength (weak -> near certain).
Induction and deduction • Example from Gauch (2003: 219) which we will return to: • Q1: Given a fair coin (P(H) = 0.5), what is P that 100 tosses will produce 45 heads and 55 tails? • Q2: Given that 100 tosses yield 45 heads and 55 tails, what is the P that it is a fair coin? • Q1 is deductive: definitive answer – probability • Q2 is inductive: no definitive answer – statistics • Oh dear: this is what we usually get in science
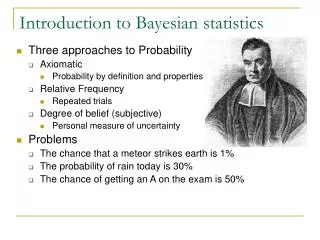
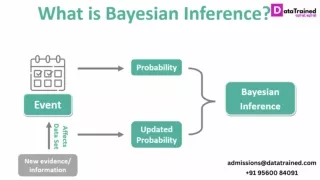
Bayes: see Gauch (2003) ch 5 • Informally, the Bayesian Q is: • “What is the probability (P) that a hypothesis (H) is true, given the data and any prior knowledge?” • Weighs different hypotheses (models) in the light of data • The frequentist Q is: • “How reliable is an inference procedure, by virtue of not rejecting a true hypothesis or accepting a false hypothesis?” • Weighs procedures (different sets of data) in the light of hypothesis
Probability? see S&S(1006) p9 • To Bayes, Laplace, Bernoulli…: • P represents a ‘degree-of-belief’ or plausibility • i.e. degree of truth, based on evidence at hand • BUT this appears to be subjective, so P was redefined (Fisher, Neyman, Pearson etc.) : • P is the ‘long-run relative frequency’ with which an event occurs, given (infinite) repeated expts. • We can measure frequencies, so P now an objective tool for dealing with randomphenomena • BUT we do NOT have infinite repeated expts…?
Bayes’ Theorem • The “chief rule involved in the process of learning from experience” (Jefferys, 1983) • Formally: • P(H|D) = Posterior i.e. probability of hypothesis (model) H being true, given data D • P(D|H) = Likelihoodi.e probability of data D being observed if H is true • P(H) = Prior i.e. probability of hypothesis being true before measurement of D
Bayes: see Gauch (2003) ch 5 • Prior? • What is known beyond the particular experiment at hand, which may be substantial or negligible • We all have priors: assumptions, experience, other pieces of evidence • Bayes approach explicitly requires you to assign a probability to your prior (somehow) • Bayesian view • probability as degree of belief rather than a frequency of occurrence (in the long run…)
Bayes’ Theorem • Importance? P(H|D) appears on the left of BT • i.e. BT solves the inverse (inductive) problem – probability of a hypothesis given some data • This is how we do science in practice • We don’t have access to infinite repetitions of expts (the ‘long run frequency’ view)
Bayes’ Theorem • I is background (or conditioning) information as there is ‘no such thing as absolute probability’ (see S & S p 5) • P(rain today) will depend on clouds this morning, whether we saw forecast etc. etc. – I is usually left out but …. • Power of Bayes’ Theorem • Relates the quantity of interest i.e. P of H being true given D, to that which we might estimate in practice i.e. P of observing D, given H is correct
Bayes’ Theorem & marginalisation • To go from to to = we need to divide by P(D|I) • Where P(D|I) is known as the ‘Evidence’ • Normalisation constant which can be left out for parameter estimation as independent of H • But is required in model selection for e.g. where data amount may be critical
Bayes’ Theorem: example • Suppose a drug test is 99% accurate for true positives, and 99% accurate for true negatives, and that 0.5% of the population use the drug. • What is the probability that someone who tests positive is in fact a user i.e. what is P(User|+ve)? • So • P(D) on bottom , evidence, is the sum of all possible models (2 in this case) in the light of the data we observe True +ve False +ve http://kochanski.org/gpk/teaching/0401Oxford/Bayes.pdf http://en.wikipedia.org/wiki/Bayes'_theorem
Bayes’ Theorem: example • So, for a +ve test, P(User) is only 33% i.e. there is 67% chance they are NOT a user • This is NOT an effective test – why not? • Number of non-users v. large compared to users (99.5% to 0.5%) • So false positives (0.01x0.995 = 0.995%) >> true positives (0.99x0.005 = 0.495%) • Twice rate (67% to 33%) • So need to be very careful when considering large numbers / small results • See Sally Clark example at end…. http://kochanski.org/gpk/teaching/0401Oxford/Bayes.pdf http://en.wikipedia.org/wiki/Bayes'_theorem
Eg Laplace and the mass of Saturn • Laplace (1749-1827) estimated MSaturn from orbital data • i.e. posterior prob(M|{data},I) where I is background knowledge of orbital mechanics etc. • Shaded area under posterior pdf shows degree of belief that m1 ≤ MSaturn < m2(he was right to within < 0.7%) • How do we interpret this pdf in terms of frequencies? • Some ensemble of universes all constant other than MSaturn? Distribution of MSaturn in repeated experiments? • But data consist of orbital periods, and these multiple expts. didn’t happen Best estimate of M The posterior pdf expresses ALL our best understanding of the problem Degree of certainty of M
Example: is this a fair coin? Heads I win, tails you lose? • H? HT? HTTTTHTHHTT?? What do we mean fair? • Consider range of contiguous propositions (hypotheses) about range in which coin bias-weighting, H might lie • If H = 0, double tail; H = 1, double head; H = 0.5 is fair • E.g. 0.0 ≤ H1 < 0.01; 0.01 ≤ H2 < 0.02; 0.02 ≤ H3 < 0.03 etc.
Example: is this a fair coin? • If we assign high P to a given H (or range of Hs), relative to all others, we are confident of estimate of ‘fairness’ • If all H are equally likely, then we are ignorant • This is summarised by conditional (posterior) pdfprob(H|{data},I) • So, we need prior prob(H,I) – if we know nothing let’s use flat (uniform) prior i.e.
Example: is this a fair coin? • Now need likelihood i.e. prob({data}|H,I) • Measure of chance of obtaining {data} we have actually observed if bias-weighting H was known • Assume that each toss is independent event (part of I) • Then prob(R heads in N tosses) is given by binomial theorem i.e. • H is chance of head and there are R of them, then there must be N-R tails (chance 1-H).
Example: is this a fair coin? • How does prob(H|{data},I) evolve? TTT HT H TTTH
Gaussian prior μ = 0.5, σ = 0.05 H0 (mean) not always at peak Particularly when N small • How does prob(H|{data},I) evolve? T
Summary • The posterior pdfsummarises our knowledge, based on {data} and prior • Note{data} in this case actually np.random.binomial(N, p) • Weak prior shifted easily • Stronger Gaussian prior (rightly) requires a lot more data to be convinced • See S & S for other priors…. • Bayes’ Theorem encapsulates the learning process
Summary • Takes a lot of coin tosses to estimate H to within 0.2-0.3 • If we toss 10 times and get 10 T, this might be strong evidence for bias • But if we toss 100 times and get 45H 55T, difference still 10 BUT much more uncertain • Gaussian: Although H(0.5) ~ 250000 H(0.25), 1000 tosses gets posterior to within 0.02
Reliability and uncertainty • Can we summarisePDF prob(H|{data},I) concisely (mean, error)? • Best estimate Xo of parameter X is given by condition • Also want measure of reliability (spread of pdf around Xo) • Use Taylor series expansion • Use L = loge[prob(H|{data},I)] - varies much more slowly with X • Expand about X-Xo = 0 so • First term is constant, second term linear (X-Xo) not important as we are expanding about maximum. So, ignoring higher order terms….
Reliability and uncertainty • We find • Where A is a normalisation constant. So what is this function?? • It is pdf of Gaussian (normal) distribution i.e. • Where μ, σ are maximum and width (sd) • Comparing, we see μ at Xo and • So X = Xo ±σ http://en.wikipedia.org/wiki/File:Normal_Distribution_PDF.svg
Reliability and uncertainty • From the coin example • So • Therefore • So Ho = R/N, and then • Ho tends to a constant, therefore so does Ho(1-Ho), so σ1/√ N • So can express key properties of pdf using Ho and σ • NB largest uncertainty (σmax) when Ho = 0.5 i.e. easier to identify highly-biased coin than to be confident it is fair EXERCISE: verify these expressions yourself
Reliability and uncertainty 95%CI • Asymmetric pdf? Ho still best estimate • But preal more likely one side of Ho than another • So what does ‘error bar’ mean then? • Confidence intervals (CI) • shortest interval enclosing X% of area under pdf, say 95% • Assuming posterior pdfnormalised (total area = 1) then need X1, X2 such that • The region X1 ≤ X < X2 is the shortest 95% CI • For normalisedpdf, weighted average given by • Multimodal pdf? • As pdf gets more complex, single estimates of mean not relevant • Just show posterior pdf, then you can decide…..
Parameter estimation: 2 params • Example: signal in the presence of background noise • Very common problem: e.g. peak of lidar return from forest canopy? Presence of a star against a background? Transitioning planet? A B 0 x See p 35-60 in Sivia & Skilling
Gaussian peak + background • Data are e.g. photon counts in a particular channel, so expect count in kth channel Nk to be where A, B are signal and background • Assume peak is Gaussian (for now), width w, centered on xo so ideal datum Dk then given by • Where n0 is constant (integration time). Unlike Nk, Dk not a whole no., so actual datum some integer close to Dk • Poisson distribution is pdf which represents this property i.e.
Aside: Poisson distribution • Poisson: prob. of N events occurring over some fixed time interval if events occur at a known rate independently of time of previous event • If expected number over a given interval is D, prob. of exactly N events • Used in discrete counting experiments, particularly cases where large number of outcomes, each of which is rare (law of rare events) e.g. • Nuclear decay • No. of calls arriving at a call centre per minute – large number arriving BUT rare from POV of general population…. See practical page for poisson_plot.py
Gaussian peak + background • So likelihood for datum Nk is • Where I includes reln. between expected counts Dk and A, B i.e. for our Gaussian model, xo, w, no are given (as is xk). • IF data are independent, then likelihood over all M data is just product of probs of individual measurements i.e. • As usual, we want posteriorpdf of A, B given {Nk}, I
Gaussian peak + background • Prior? Neither A, nor B can be –ve so most naïve prior pdf is • To calc constant we need Amax, Bmax but we may assume they are large enough not to cut off posterior pdf i.e. Is effectively 0 by then • So, log of posterior • And, as before, we want A, B to maximise L • Reliability is width of posterior about that point
Gaussian peak + background • ‘Generate’ experimental data (see practical) • n0 chosen to give max expectation Dk = 100. Why do Nk > 100?
Gaussian peak + background • Posterior PDF is now 2D • Max L A=1.11, B=1.89 (actual 1.09, 1.93)
Gaussian peak + background • Changing the experimental setup? • E.g. reducing counts per bin (SNR) e.g. because of shorter integration time, lower signal threshold etc. Same signal, but data look much noisier – broader PDF Truncated at 0 – prior important
Gaussian peak + background • Changing the experimental setup? • Increasing number of bins (same count rate, but spread out over twice measurement range) Much narrower posterior PDF BUT reduction mostly in B
Gaussian peak + background • More data, so why uncertainty in A, B not reduced equally? • Data far from origin only tell you about background • Conversely – restrict range of x over which data are collected (fewer bins) it is hard to distinguish A from B (signal from noise) • Skewed & high correlation between A, B
Marginal distribution • If only interested in A then according to marginalisation rule integrate joint posterior PDF wrt B i.e. • So • See previous experimental cases….. 2 1 15 bins, ~10 counts maximum 15 bins, ~100 counts maximum
Marginal distribution • Marginal conditional • Marginal pdf: takes into account prior ignorance of B • Conditional pdf: assumes we know B e.g. via calibration • Least difference when measurements made far from A (3) • Most when data close to A (4) 4 3 7 bins, ~100 counts maximum 31 bins, ~100 counts maximum
Note: DO NOT PANIC • Slides from here are for completeness • I will NOT ask you about uncertainty in the 2 param or general cases from here on
Uncertainty Max?? • Posterior L shows reliability of parameters & we want optimal • For parameters {Xj}, with post. • Optimal {Xoj} is set of simultaneous eqns • For i = 1, 2, …. Nparams • So for log of P i.e. and for 2 parameters we want • where Sivia & Skilling (2006) Chapter 3, p 35-51
Uncertainty • To estimate reliability of best estimate we want spread of P about (Xo, Yo) • Do this using Taylor expansion i.e. • Or • So for the first three terms (to quadratic) we have • Ignore (X-Xo) and (Y-Yo) terms as expansion is about maximum Sivia & Skilling (2008) Chapter 3, p 35-51 http://en.wikipedia.org/wiki/Taylor_series
Uncertainty • So mainly concerned with quadratic terms. Rephrase via matrices • For quadratic term, Q • Where Y • Contour of Q in X-Y plane i.e. line of constant L • Orientation and eccentricity determined by A, B, C • Directions e1 and e2 are the eigenvectors of 2nd derivative matrices A, B, C e2 Q=k Yo e1 X Xo Sivia & Skilling (2008) Chapter 3, p 35-51
Uncertainty • So (x,y) component of e1 and e2 given by solutions of • Where eigenvalues λ1 and λ2 are 1/k2 (& k1,2 are widths of ellipse along principal directions) • If (Xo, Yo) is maximum then λ1 and λ2< 0 • So A < 0, B < 0 and AB > C2 • So if C ≠ 0 then ellipse not aligned to axes, and how do we estimate error bars on Xo, Yo? • We can get rid of parameters we don’t want (Y for e.g.) by integrating i.e. Sivia & Skilling (2008) Chapter 3, p 35-51
Uncertainty • And then use Taylor again & • So (see S&S p 46 & Appendix) • And so marginal distn. for X is just Gaussian with best estimate (mean) Xo and uncertainty (SD) • So all fine and we can calculate uncertainty……right? Sivia & Skilling (2008) Chapter 3, p 35-51
Uncertainty e2 • Note AB-C2 is determinant of and is λ1 x λ2 • So if λ1or λ2 0 then AB-C20 and σX and σY∞ • Oh dear…… • So consider variance of posterior • Where μ is mean • For a 1D normal distribution this gives • For 2D case (X,Y) here • Which we have from before. Same for Y so….. e1 Sivia & Skilling (2008) Chapter 3, p 35-51
Uncertainty • Consider covariance σ2XY • Which describes correlation between X and Y and if estimate of X has little/no effect on estimate of Y then • And, using Taylor as before • So in matrix notation • Where we remember that Sivia & Skilling (2008) Chapter 3, p 35-51
Uncertainty • Covariance (or variance-covariance) matrix describes covariance of error terms • When C = 0, σ2XY= 0 and no correlation, and e1 and e2 aligned with axes • If C increases (relative to A, B), posterior pdf becomes more skewed and elliptical - rotated at angle ± tan-1(√A/B) Large, +ve correlation Large, -ve correlation C=0, X, Y uncorrelated After Sivia & Skilling (2008) fig 3.7 p. 48