Download
1 / 61
630 likes | 669 Views
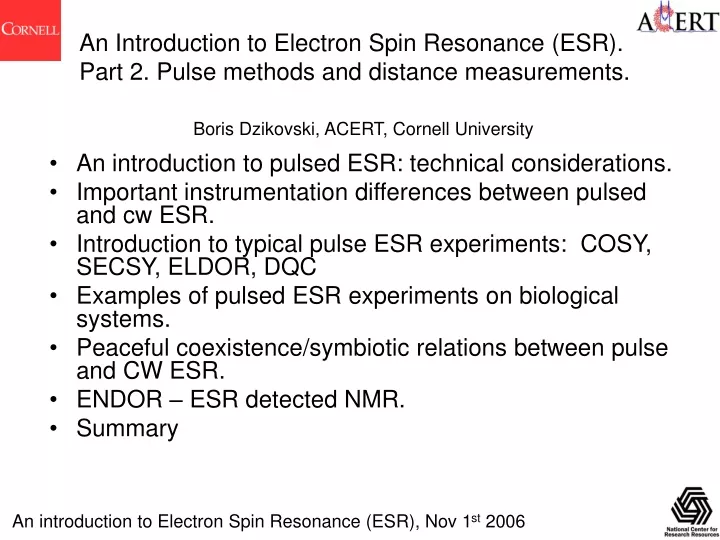
An Introduction to Electron Spin Resonance (ESR). Part 2. Pulse methods and distance measurements. Boris Dzikovski, ACERT, Cornell University. An introduction to pulsed ESR: technical considerations. Important instrumentation differences between pulsed and cw ESR.

E N D
An Introduction to Electron Spin Resonance (ESR). Part 2. Pulse methods and distance measurements. Boris Dzikovski, ACERT, Cornell University • An introduction to pulsed ESR: technical considerations. • Important instrumentation differences between pulsed and cw ESR. • Introduction to typical pulse ESR experiments: COSY, SECSY, ELDOR, DQC • Examples of pulsed ESR experiments on biological systems. • Peaceful coexistence/symbiotic relations between pulse and CW ESR. • ENDOR – ESR detected NMR. • Summary An introduction to Electron Spin Resonance (ESR), Nov 1st 2006
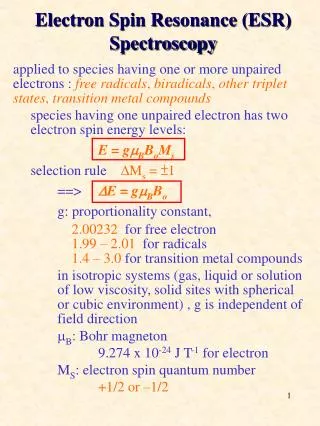
What is special about ESR, in particular spin-label ESR? • (e.g. compared to NMR) • ESR is much more sensitive per spin (than NMR). • In time domain experiments ESR’s time-scale is nanoseconds (NMR’s is milliseconds). • The spin-label spectrum is simple, and can focus on a limited number of spins. • ESR spectra change dramatically as the tumbling motion of the probe slows, thereby providing great sensitivity to local “fluidity”. • In NMR nearly complete averaging occurs, so only residual rotational effects are observed by T1 and T2. • Multi-frequency ESR permits one to take “fast-snapshots” using very high-frequencies and “slow-snapshots” using lower frequencies to help unravel the complex dynamics of bio-systems. • Pulsed ESR methods enable one to distinguish homogeneous broadening reporting on dynamics vs. inhomogeneous broadening reporting on local structure. An introduction to Electron Spin Resonance (ESR), Nov 1st 2006
Why pulse ESR? And why CW ESR still survives? Look back at the Bloch equations in the rotating frame: In an ideal pulse experiment we either irradiate spins (apply B1) or record the signal, hence, in the recording phase we do not care about B1:
CW FT • PULSE vs. CW • In Fourier Transfer Spectroscopy one records signal when B1 is zero. For CW one sees frequency modulation noise of the carrier. We also do not care about field modulation… Hard pulses: B1> spectral range • If one uses Hard Pulses, the pulse excitation can be used for all spins at once. For narrow lines a CW spectrometer measures baseline most of the time – such a waste of time… A FT spectrometer measures signal all the time. However, FT requires a broader band spectrometer. And the noise goes as a square root of the bandwidth… VS.
Sensitivity issue: one rotates all spins into the X-Y plane and detects total magnetization. In CW one usually rotates only a small fraction of the possible magnetization into X-Y plane, to avoidsaturation effects. • However: the dead-time problem in pulsed ESR. Dead time is finite time when the spectrometer relaxes to zero-power levels. It is not an issue in solution NMR, but a problem in solid state NMR and EPR. • Pulse ESR can isolate interactions and detect correlations that are not observable by CW methods. The additional information about weakly coupled spins and relaxation properties of the spin system that can be obtained by manipulating the spins with sequences of MW pulses explains the efforts put into the development of new pulse methods. • Time resolution (response time) of ~ 10 ns is much better than in CW ESR
FT ESR has clear advantage vs CW If spectral width < 100 MHz (35 G) line width < 3 MHz (1 G) Typical systems organic radicals in solution exchange narrowed lines or conduction electrons proton-free single crystals disordered solids only IF high local symmetry (cubic, tetrahedral) pathological cases (fullerenes, Mn2+ central lines) virtually no hyperfine couplings (silica glass)
A short review of basic pulse experiments (ESR and/or NMR) • Free Induction Decay (FID): • much of NMR and occasionally in ESR. In the 90-FID pulse sequence, • net magnetization is rotated down into the X'Y' plane with a 90o pulse. /2 RF pulse By using the Bloch equations: signal The complex signal which is proportional to My-iMx as called an FID and is described as: Pulse: T1 process Relaxation: T2 process
FID from 1mM TEMPO in decane One-shot S/N In phase receiver response Quadrature receiver response Receiver on
FID for T1 measurements t Two /2 pulses Pulse sequence: FID FID amplitude One measures the FID amplitude of the second pulse as a function of the time between pulses, the signal intensity is proportional to In practice, it is more convenient to measure T1from a - /2 pulse sequence called Inversion Recovery Pulse Sequence: We measure FID stepping t…. /2 t FID amplitude
Can we measure T2 from FID? It is not so simple as it seems. What we see as T2 is actually the dephasing time T2*, a combination of the real T2 relaxation and the relaxation due to inhomogeneous field on the sample and hence a variety of Larmor frequencies experienced by spins: (T2*)-1= T2-1+ (T2(inhomogenious))-1 2. Spin echo /2 t t Pulse sequence: Second pulse Refocusing
A brief history of spin echoes, with cartoons! The first nuclear spin echo observed by E. Hahn in 1950. (a-c) the "race-track" echo, (d-f) the "pancake" echo The first electron spin echo reported by R. Blume in 1958. From the website of Zürich pulse ESR group
Spin Echo: -irradiated quartz /2- sequence Spin echo In phase receiver response Quadrature receiver response
T2 is usually determined by measuring the decay of the two-pulse echo as a function of the pulse interval t: when the spread due to inhomogeneity is refocused along the Y-axis: Mx’(2t)=0 My’(2t)= We do not reverse true relaxation The Carr-Purcell-Meiboom-Gill (CPMG) sequence is derived from the Hahn spin echo and equipped with a "built-in" procedure to self-correct pulse accuracy error • If the first inversion pulse applied is shorter • (e.g. 1750) than a 1800 pulse, a systematic • error is introduced in the measurement. • The echo will form above the XY plane. • To correct that error, instead of sampling the echo immediately, a third delay is introduced, during which, the magnetization evolve slightly above the XY plane If the second inversion pulse, also shorter than 1800 (1750), is applied, as the magnetization is already above the plane, this shorter inversion pulse will put the magnetizationexactly in the XY plane. At the end of the last delay, the echo will form exactly in the XY plane self correcting the pulse error!
Stimulated (three-pulse) echo The equilibrium Z-magnetization is transferred to transverse magnetization by the first /2 pulse During free evolution of length , the magnetization dephases The second /2 pulse rotates the magnetization vectors into the XZ plane During time T, the transverse magnetization decays At time t=T + , the third /2 pulse transfers the Z-magnetization pattern again to transverse magnetization, which forms an echo at time t = T + 2 along the +Y-axis. The dotted curve represents the locus of the magnetization vector tips, the open arrow is the stimulated echo
Fourier-Transform ESR, Basic pulse sequences in 2D ESR COSY SECSY 2D FT ELDOR preparation mixing detection Corresponds to 2D-NOESY in NMR
n -15 -10 - 5 0 5 10 15 n, MHz Relationship between spectral coverage and B1 e= 2.84MHz/Gauss 5G 5G of B1 implies a /2 pulse length of approximately 18ns.
Populations and coherences Ensemble of isolated spins S=1/2. A single spin is in a general superposition state: , which means The expectation value of an operator Q: Which is ,aquadratic product of C and C then If The approach becomes useful if many independent spins involved. The ensemble average instead of becomes Operator Is known as density operator
Take a look at the matrix of the density operator: The diagonal elements are called populations of states and The off-diagonal elements are called coherences A coherencebetween two energy eigenstatesr and sdefined as: In high magnetic field, the two energy eigenstates have well-defined values of the angular momentum in the magnetic field direction: The order prsof coherence is defined as prs= Mr-Ms The populations and coherences may be identified as the coefficients of the shift and projection operators in the expression of density operator
Physical interpretation of the populations Since their sum is always equal to one, only the difference has physical significance ……and indicates net longitudinal spin polarization (in the direction of the field) Physical interpretation of the coherences (which are complex numbers): Coherence requires (1) the existence of spins with transverse polarization (superposition state); (2) the transverse polarization must be partially aligned -the phase of the (-1)-quantum coherence is the same as transverse magnetizationwith respect to the x-axis -the amplitude is the net transverse polarization. What about +1 coherence? Forget about it! See Malcolm Levitt. Spin Dynamics
The density operator allows the state of the entire spin-1/2 ensemble to be specified using just four numbers. What are the numbers? For one important point in time, thermal equilibrium: • The coherences between the states are all zero: rs(eq)=0 for rs • The populations of the energy states obey the Boltzmann distribution Define Boltzmann factor B hence High – temperature approximation: Thermal equilibrium density operator – the starting point for subsequent calculations
Effect of MW pulses on populations and coherences Strong /2 pulse Spin density operator before the pulse After the pulse (/2)x The pulse (1)equalizes the populations (2) Converts the population difference into coherences Strong pulse ()x The pulse exchange the populations of the two states, generating an inverted population distribution X,Y and Z are cyclic permutable in this relation…….. Sandwich relation for angular momentum operators
Spin ½ Rotation Operators The operator for a rotation about the x-axis through the angle is given by:
Larger spin systems: A general quantum state of the spin ½ pair: The total angular momentum defined as follows: The four Zeeman product states are eigenstates of the total z- angular momentum operator: Maa=+1 Mab=0 Mba=0 Mbb=-1 Density operator
2S1xS2z 2S1yS2z 2S1zS2x 2S1zS2y 2S1zS2z 2S1xS2x 2S1yS2x 2S1yS2y 2S1xS2y For coupled spin systems instead of rotating single angular momentum operators, one must rotate their products
Two spin system (hints on how to handle) /2 pulse Thermal equilibrium: Individual spin states give coherences as direct products Action of the /2 pulse on multiple-quantum coherences: Multiple QC transformed into single
+1 +1 +1 0 0 0 −1 −1 −1 It can help to think of pulse experiments in terms of coherence-transfer pathway diagrams • An electronic spin transition • is labeled by the ‘p’ index, • which can have values −1, 0, or +1. • If two spins are coupled, the • p index can take on larger (>+1) or smaller (<−1) values, as in DQC where products of transition operators may be excited. • The different coherences are combined in various ways to display SECSY, COSY, and ELDOR experiments. The ways always start at p=0 and come to p=-1 • Solid pathways report on inhomogeneous, dotted pathways on homogeneous broadening. COSY Sc- Sc+ SECSY Sc- Sc+ ELDOR/EXCSY preparation mixing detection Sc- Sc+
x z z z y z y y x (π/2)y x x (π/2)x y Other ways of thinking about the pulse spectrum • Sometimes, the dotted coherence path is called the FID-like path and the • solid coherence path is called the echo-like path. • The echo-like path tends to re-focus the coherence and reduce the inhomogeneous • broadening of the resonance line. • The FID-like path does not have this refocusing character (no transfer of coherence • from plus to minus or vice versa). • In order to separate out a particular coherence we generally use a phase-cycling • procedure which consists of repeating the experiment with pulses applied along • different axes in the rotating frame of the spin system. • By taking suitable combinations of the spectra produced by these pulse sequences, • we can selectively enhance those terms of the spin Hamiltonian in which we are • interested. A pulse applied along the x-axis becomes A pulse applied along the y-axis If the appropriate phase shift is applied to the pulse
Sc- signal has lower inhomogeneous broadening... …than the Sc+ signal
n -1.5 -1.0 - 0.5 0.0 0.5 1.0 1.5 tx, ms -15 -10 - 5 0 5 10 15 n, MHz One dimensional pulse experiment Fourier Transform spectrum Time domain spectrum
Example of a two dimensional Fourier Transform Spectrum Easy answer (specific goal): simulate and fit 2D-FT-ESR spectra 16-PC in pure DPPC vescicles Time domain representation Frequency domain representation General goal: 2D methods capabilities to study biological systems
True Fourier Transform Spectroscopy... 2D-ELDOR of 1mM TEMPONE in water/glycerol The active sample volume was about 500 nl. ... in aqueous samples at room temperature at 95GHz!
Spin-labeled Gramicidin A in Oriented Membrane (DPPC) B0||n • Slow motional nitroxyl spectrum at 7oC. • Orientation selection at 95 GHz (3.2 mm) • gz parallel to membrane normal (z-ordered) gy gz gx B0n
Spin-labeledGramicidin A in OrientedMembrane 2D-ELDOR (echo-like component) at 7Co T = 50 ns Slow motional regime - coverage ~350 MHz Az+1 Az 0 Note: the pulse is not hard Az-1 gy T = 200 ns gx Az+1 Az 0 gy Az-1 B0||n
What the different experiments measure: COSY The COSY experiment measures the transfer of coherence from one ESR allowed transition to another. Its time scale is usually limited to t1 + t2 < T2 SECSY The SECSY experiment is a spin echo implementation of the COSY idea. Instead of the FID detected after a COSY experiment, the echo spectrum is recorded. SECSY measures the variation of the phase memory time across the ESR spectrum since the second pulse refocuses hyperfine and resonance offsets. ELDOR By including a mixing time in this three pulse sequence and transferring coherences to the z axis, this experiment is sensitive to processes that occur on the T1 time scale which is usually longer than the T2 time scale accessible to COSY. Spectra are usually displayed in SECSY format. DQC This experiment measures distances between dipolar coupled electron spins.
2D-ELDOR, A POWERFUL TOOL FOR STUDYING MEMBRANE DYNAMICS OVER LARGE TEMPERATURE AND COMPOSITION RANGES • The phase diagram is determined based on • 1) spectroscopic evidence; • 2) dynamic parameters; • 3) recovered absorption spectra. Ld Lo gel • The new DPPC/Chol phase diagram determined by 2D-ELDOR is, in general, consistent with what was studied using a combination of different methods*, including DSC, NMR, and fluorescence techniques. Tm *( Vist, Biochemistry 29 (1990) 451; Sankaram, PNAS 88 (1991) 8686 )
Introduction to DQC • Higher order coherences can be created and manipulated in systems of coupled electron spins. • Double-quantum coherence(DQC) between two electron spins coupled by their dipole-dipole interaction is ofparticular interest. • This provides the tool separating weak dipolar couplings from stronger interactions accurate measurements of distances over a broad range. • Site-directed nitroxide spin labeling+DQC ESR • • structure determination and the study of functions • of a broad class of biomolecules such as proteins and RNA.
DQC ESR The system:two interacting spins a andb Coherences:single-quantum in-phase,I single-quantum antiphase,Adouble quantum,DQ • All these coherences can be manipulated by pulses and be refocused. • Refocusing of DQis particularly useful singles out the part of the signal • that evolves solely due to spin coupling.
DQC ESR • Antiphase coherences, which can be converted to DQC, can be prepared by • the effect of coupling terms in Spin-Hamiltonian. • The simplest case is the evolution caused by the secular part of dipolar • coupling • Manipulating with SQCs I,A, and DQC, DQin various ways led to several pulse sequences for distance measurements. • In DQC, signals unrelated to dipolar coupling are suppressed by phase-cycling • Let us consider the 6-pulse DQC sequence, which we use the most often.
2tp 2tDQ 2t2 in-phase, antiphase, double quantum 2 1 0 -1 -2 The 6-pulse DQC Sequence Signal is recorded vs. ttp - t2 tmtp + t2 andtDQ both fixed The coherence pathways for the 6-pulse DQC sequence p
Biological Applications of DQC ESR • DQC ESR is well-suited for measuring distances over a broad range. • 17 GHz DQC ESR has been applied to measure distances • from14 Å(small rigid biradicals) • to70 Å(RNAs), • with the likelihood of both limits being improved. • large distances can be measured in spin-labeled proteins, • using just small amounts.
Example: spin labeled Gramicidin A (GASL) Interspin distance= ndipolar, MHz,
ALIGNED MEMBRANE: 0 30 45 Magic 60 75 90 Dipolar frequency, MHz n There is no averaging over all orientations of the membrane normal relative to B0. BUT: a tilt of the interspin vector will manifest itself as partial averaging. Dipolar pulse spectroscopy offers a good opportunity to determine the orientation of interspin vectors and, hence, whole embedded molecules in the in the membrane
Equilibrium of gramicidin conformations in the membrane by dipolar pulse ESR In a mismatching membrane gramicidin does not form channels, but exists in some non-channel conformation which could be either double helical or monomeric. The non-channel form(s) tend to aggregate. Dipolar signal from aggregates due to many distances possible is poorly resolved, weak, and often beyond detection; this complicates identification of particular form. Solution of the problem: We use double-labeled Gramicidin with an addition of 20:1 by unlabeled GA, making the interspin distance a fingerprint of a distinct conformation. Double helical dimer (DHD) 20.0Å DPPC DLPC Monomer 31.1Å
CheA, X-Ray Structure of CheA289 construct The details of the structure of WT CheA are not known, however the structure of its subdomains and that of CheW has been solved by X-ray crystallography and NMR. Pulsed ESR dipolar spectroscopy(PDS)has been applied to establish how CheW binds to CheA289, for which the X-ray structure was determined. Site-directed Spin-labelling (SDSL) PDS requires one to introduce nitroxide reporter groups, which in our case was MTSSL that forms a covalent bond with cysteine, introduced by site-directed mutagenesis. P4 P5 P3 Cysteine residue labeling by MTS (methanethiosulfonate) reagent and the corresponding side-chain, R1, introduced into the protein. 289 of CheA from T. maritima
21Å 35.5Å 31Å 32Å 36Å 28Å 18.5Å 27.5Å 25Å 579 553 568 646 646 579 568 553 15 80 72 646 646 579 579 553 553 568 568 Spin-labeling Sites and the Distances Histidine Kinase, CheA is a dimer and binds two CheW. Thus, there are four electron spins. This is a complication, which was overcame by carefully selecting spin-labeling sites such that the distances of interest were significantly shorter than the rest, thereby making their measurement straightforward. A number of single and double cysteine mutants of CheA or 289 CheA were engineered for pulsed ESR study. CheA complexes with labeled or unlabeled CheW in various combinations have been used. 72 Average Intra-Protein Spin Distances 15 80 289 CheA CheW Intra-domain and inter-domain distances, Å. Mutated Residues CheA289: N553C, E646C, S579C, D568C CheW: S15,S80,S72
“Triangulation” A cartoon depicting the “triangulation” grid of sparse large distance constraints from ESR for CheA P5 domain (blue) and CheW (red). Small spheres represent volumes occupied by the nitroxide groups. The increase in the number of constraints (which are fairly accurate distances) will tend to reduce the uncertainty in the position of the backbone. Quick Solution: Metric Matrix Distance Geometry D is the matrix of distances dik between nitroxides i an k xjk = λk½ wjk gij = Σk=x,y,zxik· xjk = Σk=x,y,z wik·wjk·λk Metric matrix, g is constructed from D (w : eigenvector of gij; λ :eigenvalueofgij) gij = ½ (di02+dj02-dij2) Any atom as origin(0) Thus (x, y, z) coordinates of all atom found.
4-pulse DEER, another pulse method for measuring interspin dostances The echo intensity is recorded as a function of t. In the absence of dipolar interaction, a pulse at frequency 2 has no impact on echo intensity at frequency 1. Dipolar interaction causes oscillation in echo intensity with a period that is characteristic of the interspin distance. Excitation at spectral position 2 Excitation at spectral position 1 M. Pannier, S. Veit, G. Jeschke, and H. W. Speiss, J. Magn. Reson. 142, 331 (2000). From presentation by Sandra Eaton, ACERT 8/7/04)
Why CW ESR is still alive?CW NMR died many years ago… • Simpler recording, simpler interpretation and simulation. • Higher sensitivity in many cases • Most pulse ESR experiments need low measuring temperatures imposed by the short T2relaxation time, especially for transition metal ions. On the contrary, CW EPR spectra can be recorded at room temperature for a large number of spin systems, including radicals and transition metal ions Pulse and CW ESR are not rivals but rather complementary methods.
Distance measurement by ESR: numbers and orders of magnitude… r is in cm r is in Å, g assumed 2 The CW lineshape at the rigid limit is a convolution of the “no broadening spectrum” with Pake: The Fourier transform of the convolution of F and P is equal to the product of the Fourier transforms of F and P