Download
1 / 2
20 likes | 99 Views
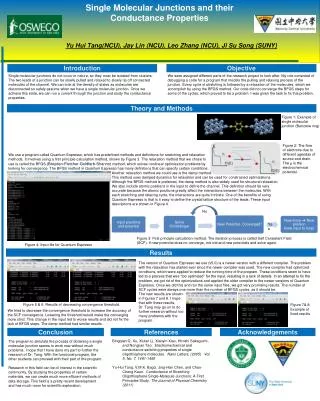
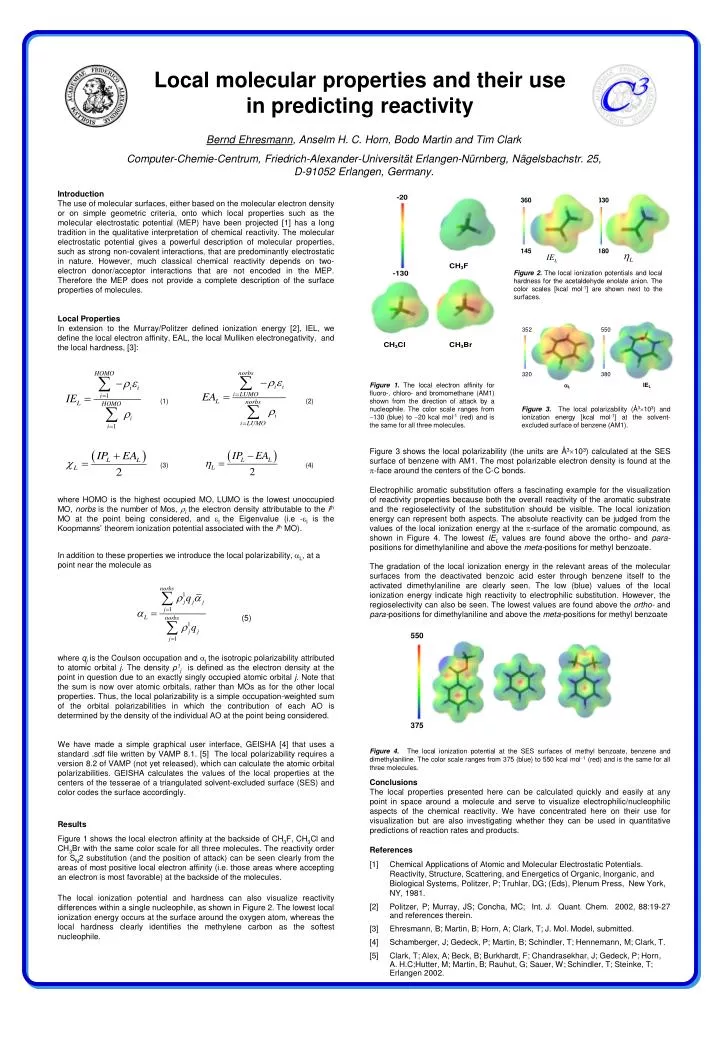
Local molecular properties and their use in predicting reactivity. Bernd Ehresmann , Anselm H. C. Horn, Bodo Martin and Tim Clark Computer-Chemie-Centrum, Friedrich-Alexander-Universität Erlangen-Nürnberg, Nägelsbachstr. 25, D-91052 Erlangen, Germany. Introduction

E N D
Local molecular properties and their use in predicting reactivity Bernd Ehresmann, Anselm H. C. Horn, Bodo Martin and Tim Clark Computer-Chemie-Centrum, Friedrich-Alexander-Universität Erlangen-Nürnberg, Nägelsbachstr. 25, D-91052 Erlangen, Germany. Introduction The use of molecular surfaces, either based on the molecular electron density or on simple geometric criteria, onto which local properties such as the molecular electrostatic potential (MEP) have been projected [1] has a long tradition in the qualitative interpretation of chemical reactivity. The molecular electrostatic potential gives a powerful description of molecular properties, such as strong non-covalent interactions, that are predominantly electrostatic in nature. However, much classical chemical reactivity depends on two-electron donor/acceptor interactions that are not encoded in the MEP. Therefore the MEP does not provide a complete description of the surface properties of molecules. Local Properties In extension to the Murray/Politzer defined ionization energy [2], IEL, we define the local electron affinity, EAL, the local Mulliken electronegativity, and the local hardness, [3]: Figure 2. The local ionization potentials and local hardness for the acetaldehyde enolate anion. The color scales [kcal mol-1] are shown next to the surfaces. Figure 1. The local electron affinity for fluoro-, chloro- and bromomethane (AM1) shown from the direction of attack by a nucleophile. The color scale ranges from 130 (blue) to 20 kcal mol-1 (red) and is the same for all three molecules. (1) (2) Figure 3. The local polarizability (Å3103) and ionization energy [kcal mol-1] at the solvent-excluded surface of benzene (AM1). Figure 3 shows the local polarizability (the units are Å3103) calculated at the SES surface of benzene with AM1. The most polarizable electron density is found at the -face around the centers of the C-C bonds. (3) (4) where HOMO is the highest occupied MO, LUMO is the lowest unoccupied MO, norbs is the number of Mos, i the electron density attributable to the ith MO at the point being considered, and I the Eigenvalue (i.e -I is the Koopmanns’ theorem ionization potential associated with the ith MO). Electrophilic aromatic substitution offers a fascinating example for the visualization of reactivity properties because both the overall reactivity of the aromatic substrate and the regioselectivity of the substitution should be visible. The local ionization energy can represent both aspects. The absolute reactivity can be judged from the values of the local ionization energy at the -surface of the aromatic compound, as shown in Figure 4. The lowest IEL values are found above the ortho- and para-positions for dimethylaniline and above the meta-positions for methyl benzoate. In addition to these properties we introduce the local polarizability, L, at a point near the molecule as The gradation of the local ionization energy in the relevant areas of the molecular surfaces from the deactivated benzoic acid ester through benzene itself to the activated dimethylaniline are clearly seen. The low (blue) values of the local ionization energy indicate high reactivity to electrophilic substitution. However, the regioselectivity can also be seen. The lowest values are found above the ortho- and para-positions for dimethylaniline and above the meta-positions for methyl benzoate (5) where qjis the Coulson occupation and j the isotropic polarizability attributed to atomic orbital j. The density ρ1jis defined as the electron density at the point in question due to an exactly singly occupied atomic orbital j. Note that the sum is now over atomic orbitals, rather than MOs as for the other local properties. Thus, the local polarizability is a simple occupation-weighted sum of the orbital polarizabilities in which the contribution of each AO is determined by the density of the individual AO at the point being considered. We have made a simple graphical user interface, GEISHA [4] that uses a standard .sdf file written by VAMP 8.1. [5] The local polarizability requires a version 8.2 of VAMP (not yet released), which can calculate the atomic orbital polarizabilities. GEISHA calculates the values of the local properties at the centers of the tesserae of a triangulated solvent-excluded surface (SES) and color codes the surface accordingly. Figure 4.The local ionization potential at the SES surfaces of methyl benzoate, benzene and dimethylaniline. The color scale ranges from 375 (blue) to 550 kcal mol1 (red) and is the same for all three molecules. Conclusions The local properties presented here can be calculated quickly and easily at any point in space around a molecule and serve to visualize electrophilic/nucleophilic aspects of the chemical reactivity. We have concentrated here on their use for visualization but are also investigating whether they can be used in quantitative predictions of reaction rates and products. Results Figure 1 shows the local electron affinity at the backside of CH3F, CH3Cl and CH3Br with the same color scale for all three molecules.The reactivity order for SN2 substitution (and the position of attack) can be seen clearly from the areas of most positive local electron affinity (i.e. those areas where accepting an electron is most favorable) at the backside of the molecules. References [1] Chemical Applications of Atomic and Molecular Electrostatic Potentials. Reactivity, Structure, Scattering, and Energetics of Organic, Inorganic, and Biological Systems, Politzer, P; Truhlar, DG; (Eds), Plenum Press, New York, NY, 1981. [2] Politzer, P; Murray, JS; Concha, MC; Int. J. Quant. Chem. 2002, 88:19-27 and references therein. [3] Ehresmann, B; Martin, B; Horn, A; Clark, T; J. Mol. Model, submitted. [4] Schamberger, J; Gedeck, P; Martin, B; Schindler, T; Hennemann, M; Clark, T. [5] Clark, T; Alex, A; Beck, B; Burkhardt, F; Chandrasekhar, J; Gedeck, P; Horn, A. H.C;Hutter, M; Martin, B; Rauhut, G; Sauer, W; Schindler, T; Steinke, T; Erlangen 2002. The local ionization potential and hardness can also visualize reactivity differences within a single nucleophile, as shown in Figure 2. The lowest local ionization energy occurs at the surface around the oxygen atom, whereas the local hardness clearly identifies the methylene carbon as the softest nucleophile.