Download
1 / 26
381 likes | 1.14k Views
Conservation strategies. Class 5 Presentation 1. Background. Biodiversity is distributed unevenly on this planet Human activity causing spp extinction rates up to 1,000 x higher than background extinction rate

E N D
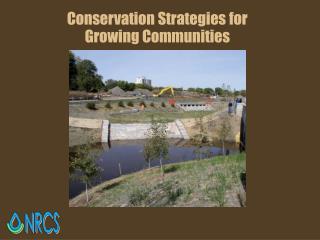
Conservation strategies Class 5 Presentation 1
Background • Biodiversity is distributed unevenly on this planet • Human activity causing spp extinction rates up to 1,000 x higher than background extinction rate • People care most about what is close to them, so response to this crisis is usually local or national • 90% of conservation funds spent in rich nations
Prioritization strategies • 9 Prioritization strategies have been developed with help from ENGOs • Why would ENGOs want to develop conservation prioritization strategies?
Purpose • Help mobilize action • Help prioritize conservation effort given limited resources
Crisis Ecoregions • Developed by the Nature Conservancy and World Wildlife Fund • Identify biomes and ecoregions where biological diversity and ecological function are at greatest risk because of extensive habitat conversion and lack of protection (not based on being spp rich) • Habitat conversion:habitat protection ratios calculated • Biomes at greatest risk: • 8:1 for Mediterranean biomes • 10:1 for temperate grass lands • Estuaries: 50% of the world’s 292 major rivers dammed • 50% of mangrove forest cleared • 2% of world’s coastal waters protected.
Biological Hotspots • High amount of endemic species • Must have 1500 endemic plant spp • High threat from human activity • Must have lost 70% of primary vegetation • First proposed by British ecologist Norman Myers in 1988 (Conservation International and the MacArthur Foundation) • Hot spot area covers 2% of Earth
Hot spot locations • Most on continents (16 of 25) • Cover 11.8% of earth (about the size of Russia), 88% of this area is lost, retain about 1.4% of earth area or 4 x France • Contain 44% of all plants and 35% of non-fish vertebrates • However, based on size,islands disproportionately represented (9) • E.g. Caribbean, Madagascar, Philippines • All in climatically benign regions, and somehow isolated
Endemic Bird Areas • Proposed by Birdlife International • 50% of range restricted birds are threatened or vulnerable • 218 areas rich in range restricted birds, 4.5% of area of earth • 77% located in tropics and sub-tropics • Countries with more than 10 EBAs = Indonesia, Mexico, Brazil, Peru, Colombia, Papua New Guinea and China
Centers of Plant Diversity • Identified by WWF and IUCN • Areas have to be rich in plant spp or have high number of endemics • Mainland: more than 1,000 spp and 100 endemics • Islands: 10% endemics or 50 endemics spp • Other factors: • Gene pool of importance to humans • Plants adapted to special conditions • High devastation of habitat by humans
Centers of Plant Diversity • 234 plant diversity centres identified • 73% in forests • 70% of plant diversity centres overlap with endemic bird areas
Megadiversity countries • Countries with a high number of spp • Concept developed by: Russell Mittermeier in 1988 • Studied primates and realized all primates found in very few countries • Megadiversity: Earth's Biologically Richest Nations, published in 1997 by the Mexican cement company, CEMEX, and Agrupacion Sierra Madre, a Mexican non-governmental organization • 17 countries have 66% of the world’s known spp • 80% of the endangered spp found in these countries
Global 200 ecoregions • What are ecoregions: • One category of a spatial hierarchy of ecosystems • A relatively large area that contains a geographically distinct assemblage of organisms that share similar dynamics and environmental conditions
Global 200 ecoregions • Proposed by the World Wildlife Fund • Analyzed marine, fresh water and terrestrial ecoregions for their irreplaceability (uniqueness) • Factors considered: • Endemic spp • Spp richness • 238 found unique = G200 • 50% classed as endangered -Unusual ecological phenomena -Global rarity of ecosystem -Unusual higher taxa
High biodiversity wilderness areas • Proposed by Conservation International • Areas retain more than 70%of their original veg • Low human density • Indigenous people maintain their lifestyles • 5 regions, cover 6.1% of earth • Contain 17% of plants and 8% of land animals
Last of the wild • Project by: Wildlife Conservation Society (WCS) and Center for International Earth Science Information Network (CIESIN) at Columbia University • Mapped human influence • 83% of land on earth used by humans • Identified 569 wild areas • May be the easiest to conserve
Frontier Forests • World’s remaining large intact forests • Proposed by World Resources Institute and Global Forest Watch • Canada home to the 2nd largest FF
Original forests Frontier Forests Global Forest Watch
Conceptual framework for conservation priority Proactive Reactive Unique and vulnerable Unique BH HBWA FF LW CE Vulnerability
Conceptual framework for conservation priority Proactive Reactive Prioritize high irreplaceability Unique EBA, CPD MC, G200 Vulnerability
Limits to these methods • Data limits: many are based on expert opinion • Costs for conservation not incorporated • Climate change not incorporated as yet • Political and institutional capacity affect biodiversity indirectly but not incorporated • Only 1 incorporates aquatic ecosystems • Invertebrates not considered directly • Transition zones and benign zones that are important for speciation or refugia • Implementation: need fine scale information
Comparisons • High degree of agreement between methods that prioritizes: • Unique regions • Vulnerable regions • Regions with low vulnerability • In total about 79% of earth’s land surface highlighted
How extinction patterns affect ecosystems • Most work has been focused on quantifying biodiversity • We need guidance on the impacts of multi species extinctions. • Many problems limit research: • We use computer models, assume random extiction • Extinction not random
Results of 2 studies: Study 1 • Marine sediment invertebrate spp database • Used spp extinction modelled to measure impact on ecosystem • Found that large spp, with high abundance and high mobility had major impact when it went extinct. • Small bodied and rare spp had small impact
Results of 2 studies: Study 2 • Experimental plots of 21 grassland California spp and impact of invasive spp (yellow thistle) • Found that spp rich plots were more resistant to invader