Download
1 / 27
270 likes | 287 Views
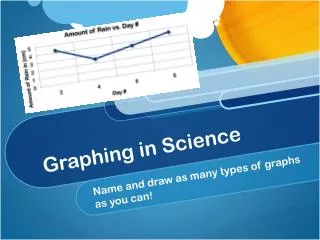
This quiz page focuses on graphing in context, specifically representing functions that involve speed, height, and quantity. Students are given various scenarios and asked to identify the graph that best represents the given function.

E N D
Graphing in Context F-IF.4, F-LE.1, N-Q.2, N-Q.1
QUIZ Page 21 – 22 in your WorkbookRip it out when you’re done
1. A school bus drives 30 miles per hour for a while and then pulls into the school and lefts off students. Which graph best represents the bus’ speed as a function of time?
2. A bungee jumper jumps off a 100-foot high bridge. Which graph best represents her height from the ground as a function of time?
3. A bicyclist climbs up a hill at a steady pace of 10 miles per hour and then speeds up as she glides down the other side. Which graph best represents her speed as a function of time?
4. An anteater at the zoo is given ants for lunch. He slowly eats 4 ants and takes a break, repeating this pattern throughout lunch. Which graph best represents the number of ants remaining as a function of time?
5. A lawn service mows the grass every three weeks. Which of the below graphs best represents the height of the grass as a function of time?
Table of Contents 12: Workbook pages 29 – 30 13: How Do I Graph in Context?
EQ: How Do I Graph in Context? 12/20/2019
Increasing Function A function with a graph that goes up as you look left to right. Ex. Positive Slope Decreasing Function A function with a graph that goes down as you look left to right Ex. Negative Slope
A function with a graph of a horizontal line Constant Function Ex. Zero slope
Turn to Page 27 and cut out the graph Glue/Tape this into your notebook to be Example 1 Take out three different colored pens/pencils/highlights
Example 1: Cierra goes for a ride on her skateboard. The graph shows her distance versus time.
Increase Decrease Constant Using your different colored pens, show where the graph is increasing, decreasing, and staying constant
During which times is Cierra traveling away from her house? When the graph is increasing, Cierra is getting farther from home A to B and E to F
During which times is Cierra going the fastest on her skateboard? Cierra is going fastest on her skateboard where the line is the steepest A to B: 2 m/s C to D: 1 m/s E to F: 4 m/s G to H: 3.5 m/s
What is Cierra doing between times B and C? Since the line is horizontal, Cierra is staying stationary. Cierra is tying her shoe
What is Cierra doing between points G and H? The graph goes from the highest point to the lowest point. Cierra is traveling straight home.
Turn to Page 29 in your workbook for your guided practice. Do your work right in your workbook
Distance from home time Guided Practice 1 Keoni walks at a constant rate and arrives 10 minutes before the bus.
Distance from home time Guided Practice 2 Keoni is late. He runs as fast as he can until he gets tired, and then walks the rest of the way, arriving just in time to catch the bus.
Guided Practice 3 Distance from home time Keoni walks at a constant rate until he runs into one of his old acquaintances, one with whom he used to get into trouble with all the time. This acquaintance is skipping school today and is trying to convince Keoni to join him. Keoni talks with her for about 5 minutes, realizes he will miss the bus if he doesn’t leave right away an d runs the rest of the way at a constant rate, arriving just in time to be the last one on the bus
Guided Practice 4 Distance from home time This time Keoni is really late! He runs as fast as he can all the way to the bus stop, but runs slower and slower as he gets tired…after all, it is a whole mile. But, he appears to have missed the bus. He waits and waits (about 20 minutes) and then remembers it is Prince Kuhio Day…a holiday! He runs as fast as he can home…exactly the same as on the way to the bus stop…fast at first and tiring when he approaches his destination, just in time to catch the end of the morning cartoons.
Guided Practice 5 Distance from home time Keoni is early today, so he walks at a leisurely rate. About a quarter of the way to school, he realizes he forgot his math homework, again! He walks briskly back home, but about halfway back home, he remembers he didn’t have math homework, so he walks even faster to the bus stop, arriving about 1 minute before the bus arrives.
Guided Practice 6 Distance from home time Keoni has plenty of time to get to the bus. He walks slowly for awhile, but then stops to watch a gecko chase a bug. He continues at a slightly faster pace for awhile longer and stops again, this time to tie his shoe and watch a man unload tools from his truck. He realizes he’s possibly late now and continues at a still faster pace until he arrives just in time to catch the bus.
Questions When looking at a graph, how can you tell that one part is increasing faster than another part? Can your graphed lines be curved or do they always need to be straight? Why? How can the labels help you graph your story? Describe the shape of the graph of something that starts slow and gets faster.
Classwork/Homework Do Pages 5 – 9 in your new workbook. Make sure to rip out the pages to turn in next class.