Download
1 / 61
640 likes | 945 Views
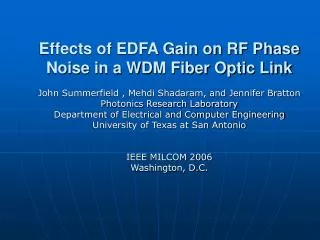
EFFECT OF ASE NOISE ON M-QAM FIBER OPTIC LINK PERFORMANCE. Jennifer Doris James. Overview. Fiber Optic Basics Erbium Doped Fiber Amplifiers Digital Communications Experimental Procedure Experimental Results Conclusions. Why Fiber Optics?. Advantages of Fiber Optic Communications:

E N D
EFFECT OF ASE NOISE ON M-QAM FIBER OPTIC LINK PERFORMANCE Jennifer Doris James
Overview • Fiber Optic Basics • Erbium Doped Fiber Amplifiers • Digital Communications • Experimental Procedure • Experimental Results • Conclusions
Why Fiber Optics? • Advantages of Fiber Optic Communications: • Low loss • Large bandwidth • Immunity to electromagnetic interference • High propagation delay stability • No Radiation • Reliability • Economy • Parallel transmission • Flexibility & Ruggedness
Optical Waveguides • Total Internal Reflection • Operates in 800 to 1600 nm range • Transmission windows with low attenuation
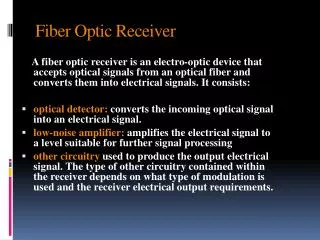
Basic Fiber Optic Link • 4 Major components required: • Light source • Modulator • Optical fiber • Photodetector
WDM Fiber Optic Communications • Transmission of multiple wavelengths simultaneously on a single fiber. • Allows for multiple data formats to be transmitted simultaneously.
Purpose of Research • Evaluation of the performance of M-QAM fiber optic links. • Primary source of noise under investigation: Amplified Spontaneous Emission noise
Overview • Fiber Optic Basics • Erbium Doped Fiber Amplifiers • Digital Communications • Experimental Procedure • Experimental Results • Conclusions
Erbium Doped Fiber Amplifier (EDFA) • Incoming optical signal is coupled with light from a pump laser. • Both are transmitted over a length of doped optical fiber • The amplified optical signal is output after any residual light from the pump laser is filtered.
Operation of EDFA • Erbium ions are excited into the pump band by a pump laser • Amplification is achieved by stimulated emission of photons from the excited Er3+ ions in the fiber.
Amplifier Gain • EDFA gain is non-uniform and dependent upon the input power. Ps,out = signal output power Ps,in = signal input power Pp,in = input pump power lp = pump wavelength ls = signal wavelength
Amplified Spontaneous Emission (ASE) • Amplified Spontaneous Emission (ASE) noise arises from the spontaneous recombination of electrons and holes in the amplifying medium. • Emitted photons resulting from this transition has random phase and amplitude.
Power Spectral Density of noise resulting from ASE • Single side band PSD of ASE noise: G = amplifier gain hf = photon energy c = a parameter used to account for the non-uniform carrier density due to gain saturation hsp = population inversion factor n1 = fractional density of electrons in state 1 n2 = fractional density in state 2
PSD of RF Phase noise due to ASE • In communications schemes that transmit information in both the amplitude and phase of the signal, such as M-QAM, RF phase noise must also be taken into consideration. Go = small signal gain h = quantum efficiency of the EDFA Pin is the input power to the EDFA Psat and a are parameters associated with gain saturation of the EDFA Fn is the noise figure of the EDFA in dB
RF Phase noise due to ASE • As shown in the previous equation, RF phase noise is also dependent upon the gain of the amplifier. • Experimental results previously obtained also confirm this as shown in this graph.
Overview • Fiber Optic Basics • Erbium Doped Fiber Amplifiers • Digital Communications • Experimental Procedure • Experimental Results • Conclusions
The Digital Cliff • Digital signals are not as affected by distortion and interference as analog signals. • In fact, the quality of the signal does not degrade until the signal to noise ratio passes a certain threshold. • Unfortunately, once it passes the threshold, the signal degrades quickly, leading to a phenomenon referred to as the “digital cliff”.
Quadrature Amplitude Modulation (QAM) • Quadrature Amplitude Modulation (QAM) modifies the phase and amplitude of the signal simultaneously. • QAM offers increased data throughput and spectral efficiency. • QAM is the standard for • Data Over Cable Service Interface Specification (DOCSIS) • Digital Video Broadcasting – Cable (DVB-C) • Digital television, as standardized by the Society of Cable Television Engineers (SCTE)
QAM Transmitter • QAM is accomplished by varying the amplitude of two sinusoidal waveforms that are in quadrature (a 90 degree phase shift) to each other respectively and summing them together. • This allows the effective transmission of two channels at the same frequency, thereby doubling the bandwidth or rate at which the data is transmitted.
QAM Signal Representation • Can be represented as a linear combination of two orthonormal waveforms, f1(t) & f2(t). • Amc and Ams, are the amplitudes of the signals of the quadrature carriers • g(t) is the signal pulse • eg is the energy of the pulse
QAM Signal Impairments • Common impairments • Additive white Gaussian noise (AWG) • RF phase noise • Coherent interference • Gain compression • I/Q phase error • I/Q gain error
QAM Performance Analysis • In determining the performance of the QAM signal, there are several tools available: • Constellation Diagram • Eye Diagrams • Bit Error Rate • Modulation Error Ratio • Error Vector Magnitude • Magnitude and Phase Error
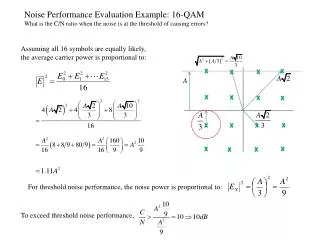
Constellation Diagrams • QAM signals can be represented as vectors, in terms of the inphase, I, and quadrature, Q, components. • I and Q data can be displayed on a 2 dimensional graphs known as constellation diagrams. • Each point on the I/Q plane represents a symbol, which in turn represents a specific set of bits. • By increasing the number of symbols, M, the number of bits represented by each symbol is increased as well. M = 2N, where N = number of bits per symbol.
Eye Diagrams • Constructed by superimposing the signal repetitively on itself several times. • Eye diagrams can also give indications of timing deviations and distortions. Time variation at zero crossing Distortion SNR at sampling point
Bit Error Rate (BER) • Defined as the ratio of bits received in error to the number of bits transmitted. • Bit Error Rate for M-QAM with Gray coding applied: Where: And: gs is the average carrier to noise ratio of the link and M is the number of possible QAM symbols
Modulation Error Ratio (MER) • MER is the ratio of the RMS error magnitude over the average symbol magnitude. • National Instruments defines MER over N number of symbols as I & Q components of the j-th received symbol ideal I & Q components of the j-th symbol
POOR MER GREAT BER GOOD MER GREAT BER GREAT MER GREAT BER Why use MER? • Measures the mean deviation of received symbols from the ideal symbol values • Incorporates all impairments of QAM • Chosen as the preferred measurement for cable TV by the SCTE • Declared an international standard by the DVB Measurement Group • MER provides an early indication of the performance of the signal and is a good indicator of non-transient impairments of the system. • Analysis of the BER alone would not give any indication that the system is approaching the digital cliff and imminent failure A signal with a poor MER would still be showing excellent BER results.
Error Vector Magnitude (EVM) • Expressed as a percentage, provides the same information as MER. • EVM is the ratio of the error vector and the ideal vector, e/v , where e = w – v .
Magnitude and Phase Error • Magnitude error is the difference between the ideal magnitude and the measured magnitude. • Magnitude errors affect I and Q equally, resulting in movement of the symbols away or toward the origin on a constellation diagram. • Similarly, phase errors, shown as q in the previous diagram, are the difference between the ideal phase and the measured phase of the received symbol. • Both measurements are represented as percentages, similar to the EVM.
Overview (cont.) • Fiber Optic Basics • Erbium Doped Fiber Amplifiers • Digital Communications • Experimental Procedure • Experimental Results • Conclusions
QAM Signal Generation & Analysis (cont.) • QAM Generation VI • The data stream is a pseudo-random sequence of bits continually repeated until the program is stopped by the user. • The baseband signal is then upconverted to the appropriate frequency by the vector generator. • Capable of generating 4, 8, 16, 32, 64, 128, and 256 QAM. • Pulse shaping filter, resampling of the data, and assurance of the phase continuity of the data is also handled in the program. • QAM Demodulation VI • Analog signal is acquired and downconverted • Downconverted signal, represented as a complex waveform, is resampled and passed along to the demodulator • Output of the demodulator gives us the “recovered waveform” with the frequency and phase offset removed
Lab Equipment • National Instruments PXI-5670, 2.7 GHz RF Vector Generator • Ando Electric Corporation AQ4321D Tunable Laser • JDS Uniphase AM-150 APE microwave analog intensity modulator • Corning SMF-28 Optical fiber • Fiber Instrument Sales Erbium Doped Fiber Amplifier (FIS EDFA) • New Focus 3.5 GHz InGaAs Photoreceiver, Model 1592 • Inline Variable Attenuators, Blocking style
Gain Characteristic of FIS EDFA • As mentioned previously, the gain of the EDFA is dependant upon the input power of the device.
Overview (cont.) • Fiber Optic Basics • Erbium Doped Fiber Amplifiers • Digital Communications • Experimental Procedure • Experimental Results • Conclusions
Visual Comparisons 16 QAM Gain = 44 dB, MER =19.7 dB Gain = 27 dB, MER = 35.7 dB
Visual Comparisons 64 QAM Gain = 27 dB, MER = 34.8 dB Gain = 42 dB, MER =22.3 dB
Visual Comparisons 256 QAM Gain = 27 dB, MER = 34.4 dB Gain = 36.9 dB, MER =27.9 dB