Download
1 / 29
290 likes | 437 Views
Idaho Property Taxes and the Idaho Tax Structure. Dan John Tax Policy Manager Idaho State Tax Commission. June 2005. Idaho Fiscal Year 2004 General Account State Tax Revenue. Sales Tax $ 886. Corporate Income Tax $ 101. Other Taxes $ 50. Individual Income Tax $ 873.

E N D
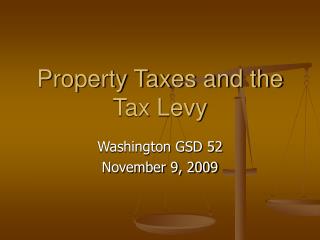
Idaho Property Taxes andthe Idaho Tax Structure Dan John Tax Policy Manager Idaho State Tax Commission June 2005
Idaho Fiscal Year 2004 General AccountState Tax Revenue Sales Tax $ 886 Corporate Income Tax $ 101 Other Taxes $ 50 Individual Income Tax $ 873 Millions of Dollars Represents funds that go to the general fund refunds have been deducted. Where the money came from. 2
Where the Sales Tax Goes$ Million in Fiscal Year 2004 Other Funds $ 142.6 Building Fund $ 5.0 Water Pollution $ 4.8 Circuit Breaker $ 14.1 Business Inventory Replacement $ 51.4 County Revenue Sharing $ 58.9 City Revenue Sharing $ 58.9 General Account $ 886.1 Building Fund increased to $5 million in 2001.
Idaho Fiscal Year 2004 RevenueState and Local Tax Revenue Sales* $ 1,009 Mil. 30% Motor Fuel $ 217 Mil. 6% Other $ 50 Mil. 1% Corporation Tax $ 101 Mil. 3% Property $1,141 Mil. 34% Individual Income Tax* $ 878 Mil. 26% Where the Money Came From Millions of Dollars Property Tax is Calendar 2004 * Sales Tax include revenue sharing; Income Tax includes Permanent Building Fund.
Idaho Fiscal Year 2004 General Account Appropriations Other Education $151 – 11.7% Health & Welfare $ 393.1 – 19.6% Colleges $ 199 – 15.4% All Education $ 1,292 – 64.5% Public Schools $ 943 – 72.9% All Other $ 318.6 – 15.9% All Funding Education Funding Millions of Dollars
TAXES COLLECTED IN IDAHOPROPORTION OF STATE & LOCAL TAX REVENUE PROPERTY TAX IS CALENDAR YEAR; OTHERS ARE FISCAL YEAR
2004 Property Tax Use City 21.6% $ 246.0 Mill 3.6% $ 3.0 Mill Cemetery 10.5% $ 8.8 Mill Jr. College School 42.8% $ 487.8 Mill 41.9% $34.9 Mill Fire Other 7.3% $ 83.3 Mill 44% $36.7 Mill Miscellaneous OTHER 7.3% County 23.0% $ 263.4 Mill Highway 5.3% $ 60.3 Mill TOTAL
Taxing Districts 1079 1071 1069 1066 1060 1052 1044 1039 1031 1023 919 908 909 904 900 885 888 892 883 885
Fiscal Year 2002 Tax BurdenIdaho vs. Neighbor States Percent of U.S. average Based on per capita taxes. States compared to U.S. average.
FY 2002 Property Tax BurdenIdaho vs. Neighbor States Idaho Mt Nv Or Ut Wa Wy Based on taxes per $ of income.
FY 2002 Overall Tax BurdenIdaho vs. Neighbor States Idaho Mt Nv Or Ut Wa Wy Based on taxes per $ of income.
FY 2002 TaxesIdaho vs. U.S. Type of Tax Rank 31 - Property Rank 27 - Sales Rank 22 – Ind. Income Rank 30 – Corp. Income Rank 3 - Motor Fuels Rank 38 - Overall Rank of 1 = highest tax Based on Taxes per $ of income Percent Difference from U.S. Average
FY 2002 TaxesIdaho vs. U.S. Rank 37 - Property Rank 39 - Sales Rank 30 – Ind. Income Rank 34 – Corp. Income Rank 8 - Motor Fuels Rank 44 - Overall Rank of 1 = highest tax Based on Taxes per person Percent Difference from U.S. Average
Estimated 2002 TaxesPer Family - various income levels Percentages show Idaho compared to U.S. average. +16% -21% -23% +01% -21% -37% -95% -20% -42% Estimates for Boise, based on District of Columbia studies of largest cities in each state.
Taxing Districts and Tax Code AreasHypothetical County City A North Highway East School South Highway City B West School County
How are Levies Calculated? Each property is appraised to find its market value. All values within a taxing district (school, city, etc.) are summed. Homeowner’s (and other) exemptions are subtracted. The taxing district computes its property tax budget by subtracting other revenue sources. The levy rate is the property tax budget divided by the net taxable value. $ 80,000 = 0.0080 = .80% Example: $10,000,000
YOUR PROPERTY TAXESHow are they Calculated? 1. Levies for your taxing districts are added together: a) County b) School c) City d) Special Districts 2. The total of these levies is multiplied by your taxable value to determine your tax. Example of Computation Assume levy = 0.01743 (average urban ooc-residential rate in 2004) House Value: $ 60,000 Lot Value: $ 15,000 Total Value: $ 75,000 Less Homeowner’s Exemption: <$ 30,000> Taxable Value: $ 45,000 $ 45,000 x 0.01743 = $ 784 Effective tax levy: $ 784 $ 75,000 = 1.05%
Limits on Property Taxesin effect since 1995 • School M&O levies limited to 0.003* multiplied by prior year value. • Funds of taxing districts limited to certain maximum levy rates. • Portion of taxing district budget derived from property tax can increase up to 3% per year, plus an amount for new construction and annexation. • There is no limit on the amount that an individual’s property tax can increase from year to year - • Depends on distribution of value -- • Did your property value increase faster than other property? * = Boise School’s multiplier is 0.00664167
Boise Homeowner Property Tax 1980 vs. 2003 Value (average sale): $ 45,587 1980: Tax: $ 484 Value (average sale): $ 166,770 2003: Tax: (Ada TCA1001) $ 2, 094 2003 Inflation Adjustment: Tax: $ 891 Constant dollar annual increase: 2.7% 2003 values based on 2002-03 sales and 2003 tax rate. 25
PROPERTY TAXESby Major Category of PropertyCURRENT DOLLARS Millions of dollars
PROPERTY TAXESby Major Category of PropertyConstant 1978 Dollars Millions of dollars
Per Capita Property TaxesIdaho vs U.S. Adjusted for Inflation Based on U.S. Census Information Values adjusted to January 1977
Changes in Property Tax Use2003 – 2004 by taxing district type
System Change (What if...) Increase homeowner's exemption: a. $50,000 limit b. Add land ($ limit same) c. Add land ($ limit higher) d. 50% limit ($ limit same) e. 50% limit ($ limit higher) Cap assessed value changes: Homes or all property Increase circuit breaker: Benefits, income limits, or add new groups Property Tax Shift Commercial, rental, farm, AND: a. homes below $100,000 b. $100,000+ homes, MH c. Mobile homes, 2nd homes d. $100,000+ homes e. Mobile homes, 2nd homes Properties appreciating slowly including farms, and property which depreciates such as business personal property No property tax shift Replacement from state taxes Dynamics of Property TaxIn a Budget ($) Driven System Assumes that same amount of money is to be raised
Effect of Value Increase LimitsAssume total taxes frozen; amount to be raised for each year is $ 1,000 Prior Year Current Year Property A Value $ 100,000 Property A Value $ 100,000 Levy = 0.005 Levy = 0.0025 Property B Value $ 100,000 Property B Value $ 300,000 Property A tax = $500 Property B tax = $500 Property A tax = $250 Property B tax = $750