Download
1 / 50
500 likes | 589 Views
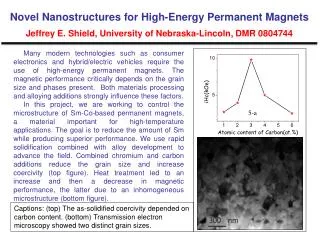
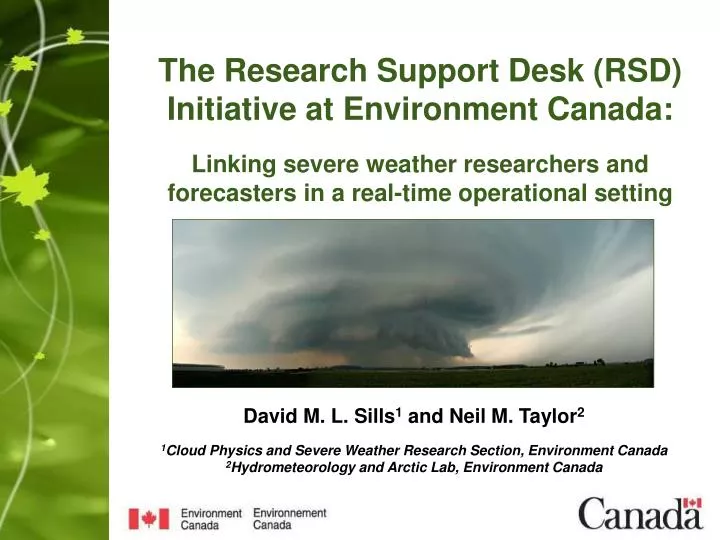
The Research Support Desk (RSD) Initiative at Environment Canada: Linking severe weather researchers and forecasters in a real-time operational setting. David M. L. Sills 1 and Neil M. Taylor 2 1 Cloud Physics and Severe Weather Research Section, Environment Canada

E N D
The Research Support Desk (RSD) Initiative at Environment Canada:Linking severe weather researchers and forecasters in a real-time operational setting David M. L. Sills1 and Neil M. Taylor2 1Cloud Physics and Severe Weather Research Section, Environment Canada 2Hydrometeorology and Arctic Lab, Environment Canada
Outline • Background • The RSD Initiative • Objectives • The RSD at OSPC in Toronto • Scientific focus • Field Experiment Support • Verification • Future Plans • The RSD at PAPSC in Edmonton • Scientific focus • Field Experiment Support • Verification • Future Plans • Summary
Forecast-Researcher Collaboration Sustained collaboration between forecasters and researchers, particularly when they are co-located, shown to be a very fruitful endeavor NSSL Spring Program 2003 Sydney 2000 Forecast Demonstration Project
…enhance technology and knowledge transfer via co-location of forecasters and researchers. ASPC PASPC QSPC PSPC OSPC National Laboratories
Researchers evaluate new tools / techniques and provide interactive training in a real-time setting, thereby providing assistance to forecasters during HIW events • Forecasters see new nowcasting • techniques, tools and data in action, • and influence their development The RSD Initiative The Research Support Desk (RSD) initiative takes this one step further and facilitates the interaction of forecasters and researchers in real-time - a unique approach:
New science / technology may be needed, may find that current science / technology needs updating or is used incorrectly • Researchers may have more insight on cutting-edge solutions • Such science gaps are communicated back to the greater research community The RSD Initiative • Researchers also gain first-hand knowledge of the ‘science gaps’ facing forecasters
Staffing an RSD • Who should work at a RSD? • Ideally, someone from research community with met expertise and some experience in operations (could be EC or perhaps university) • Or could be a ‘subject matter expert’ from operations with some research experience (MTs working in the national labs, or nearing retirement) • In either case, excellent communication skills essential
Toronto: warm seasons since 2004, focus on nowcasting mesoscale boundaries and thunderstorms in the Great Lakes region • Edmonton: warm seasons since 2006, focus on boundary-layer processes affecting convective initiation on the Prairies Currently Two RSD Locations… ASPC PASPC QSPC PSPC OSPC
The RSD at OSPC in Toronto • Located in operations area adjacent to summer severe weather lead desk and student desk • One or more ResMets work shifts to cover as many potential severe weather events as possible between May and September
The RSD at OSPC in Toronto • RSD tools have evolved since 2004: Aurora prototype object-oriented nowcasting workstation • Two 21” LCD touch screens for use with Aurora • operational forecast workstation (IFW) • HAILCAST, RAOB, Burrows lightning, GEM-LAM2.5, etc.
Convective Nowcasting • Science gap identified: mesoscale analysis and convective nowcasting • Extrapolation of radar echoes can give a first order estimate of intensification / dissipation of deep moist convection (MAPLE) • Mesoscale boundary information can improve these, and allow convective initiation nowcasts • Once boundary locations are known, other factors can be examined such as CAPE, CIN, shear, cloudiness, etc. → obs, 1-hour RUC fields and conceptual models are used for this purpose • Storm intensity and convective mode also need to be nowcast The basis of a good nowcast is a good mesoanalysis!
Optimal Human-Machine Mix • Make best use of human strengths and expertise? • Judgment / decision-making • Pattern recognition • Conceptual and mental models • Adaptive strategies • Make best use of machine strengths? • Dealing with large volumes of data • Integrating multiple datasets • Handling complex calculations and complicated parameter interactions • Automating product generation • Enhance human expertise? • Regular hands-on analysis, diagnosis and prognosis • Conceptual models and dynamic mental models required
Aurora Nowcasting Prototype • Aurora(Greaves et al. 2001) is a prototype nowcasting platform being used to test nowcasting concepts and techniques that may be implemented in NinJo • Prototype is focused on optimization of the human-machine mix • Uses a modifiable database made of gridded fields and object fields, including user-entered objects such as fronts
Aurora Nowcasting Prototype • Ingests radar, satellite, surface observations, lightning and NWP (GEM-REG, GEM-LAM, RUC) • Can automate the generation of any number of products from the database • Has the capacity for expert system algorithms using objects and fields in the database, including those modified by the nowcaster
Areas of convection 18-21Z Lake breeze fronts
1 hr convective trend nowcasts Lake breeze fronts The basis of a good nowcast is a good mesoanalysis!
Automated daily convective forecast verification for 27 Jun 08
OSPC RSD on the Web • Current and archived RSD products are easily accessed via an internal web site: ospc76.to.on.ec.gc.ca/rsd • Aurora data are archived to facilitate case studies of important events
Field Experiment Support • Supported the BAQS-Met 2007 lake breeze / air quality / severe weather field study in SW Ontario • BAQS-Met prognosis and analysis products were a subset of regular RSD products • Communicated with field team during briefings • Forecasters had access to special data sets in real time plus preliminary results
OSPC Forecaster Survey Results Anonymous survey results after 2005 season: ● 100% were comfortable with a researcher in the operational area (initially 63% 2004) ● 83% interacted with the RSD occasionally to very often (78% 2004) ● 88% thought that the RSD improved the quality of OSPC forecasts / watches / warnings (64% 2004) ● 72% thought the RSD provided an enhanced learning environment (59% 2004) ● 83% had a positive overall impression of the RSD (81% 2004) ● 94% wanted to see the RSD continue into the future (81% 2004)
An Interesting Survey Result When asked about their preferred learning method: • “mentoring during real-time events” rated first • “simulations” and “COMET-type training modules” tied for second • “Reading scientific papers” and “attending seminars” rated a distant third and fourth, respectively Mentoring is labour intensive for the researcher, but over a period of years may be more efficient than traditional ‘broadcast’ methods (presentations and papers).
Quantitative Verification • Also working on ways to quantitatively verify RSD experimental techniques, and the impact of the RSD on operations – more difficult than qualitative • RSD operated on 50% of days in 2008 in order to compare severe weather warning verification stats for RSD and non-RSD days
Future Plans • Possible operation of Ontario RSD in ‘winter mode’ focusing on mesoscale features such as snow squalls and rain-snow boundaries: • - Test in winter 2004-2005 showed promise, especially with detecting rain-snow boundaries using newly developed polarimetric radar fields • For summer 2009, invite researchers for day or two of double-banking on the RSD – volunteers?
Future Plans • Also for summer 2009, a ‘storm-scale’ nowcasting prototype currently under development will be tested: • Science gaps identified -> need for ‘warn on forecast’ approach at storm scale and vastly improved warning region selection technology to improve lead times • Forecaster should focus on meteorology, not product generation • - Nowcaster would work with storm objects within Aurora (NinJo) and utilize conceptual / mental models • - Warning bulletin generation would be automated
URP Cells, Tracks and Ellipses …ingested by Aurora
Summer Convective Nowcasting with Aurora • Prototype based on input from URP cell tracker and URP severe weather algorithms • Forecaster is able to add and/or adjust forecast tracks using the line editing tools in Aurora • Forecaster is also able to delete tracks, or filter tracks by changing the cell intensity threshold (i.e. only display cells / tracks with centroids higher than 45 dBz) • Modified forecast track used to provide content for warnings (e.g. affected regions / locations along track, speed, direction, etc.) • Would eliminate the need for a ‘warning region selector’ in NinJo
Ellipse colour indicates convective trend for next 30 min • red = intensification • yellow = initiation • green = dissipation • grey = no change • Cell node indicates location of reflectivity core, ellipse size indicates approx. size of 40 dBz area (threshold is adjustable) Radar echo URP track • Past cell nodes are open circles, current cell node is filled square, future cell nodes are filled circles Surface boundary position from most recent mesoscale analysis 2000 UTC
Forecaster’s mental model: supercell will continue veer rightward and intensify upon encountering the surface boundary, after which it will begin to dissipate and return to non-deviate storm motion • Forecaster chooses 1-hr track (options are 30, 60, 90, 120 min) and draws the curves representing the future tracks 2000 UTC
New node labels are automatically placed along the track at 10 min intervals with equal spacing based on the track option chosen (in this case, a 1-hr track was chosen) • Node labels are enhanced (lighter grey) at 30 min intervals 2000 UTC
Aurora automatically places ellipse objects around cell node locations along the track 2000 UTC
Trend is INTENSITY (current cell) – INTENSITY (previous cell) • Based on the forecaster’s mental model, the ellipses are modified to indicate intensity trend and cell size • Intensity trend for each ellipse is chosen via a pop-up menu Display cell attrbutes including SCIT data trends (meso, hail, WDRAFT, etc.) for cell Convective Trend Options O Intensification O Initiation O Dissipation O No change 2000 UTC
Based on the forecaster’s mental model, a severe thunderstorm warning area is drawn that encompasses all locations where severe weather is likely • Nowcast uncertainty built into shape of warning area – increasing coverage with time 2000 UTC
A pop-up window allows the forecaster to check off which severe weather elements to include in the warning and add uncertainty information via free-form text Severe Thunderstorm Warning O Hail O Damaging Winds O Heavy Rain O Possibility of tornado 2000 UTC
At 2010 UTC, new URP track guidance arrives and is displayed • Red ellipses indicate a positive intensity trend forecast by URP • Previous forecaster-entered track is also displayed 2010 UTC
By default, the new guidance is accepted • This allows for automated cell tracking if the forecaster is busy with other activities • The forecaster can adjust this track if needed using Aurora line editing tools 2010 UTC
However, the forecaster can also choose to draw a completely new forecast track • A 90 min track is shown here, and cell node labels would be automatically added at equally spaced 10 min intervals along the track • Labels are highlighted at 30 min intervals 2010 UTC
The forecaster can adjust this track if needed using Aurora line editing tools • In this case, the forecaster chose to use the previous track instead of the guidance • Thus, the track start is automatically shortened by 10 min and filled square placed at new first cell node from the old forecast track • Track length can be increased by 10 min to maintain a 1-hr track, or left as is to forecast the termination of the cell in 50 min 2010 UTC
Also need the ability to easily add a new track for a ‘developing’ cell in the case of convective initiation (a shower forecast to become a thunderstorm) • In this case a 30 min track was selected • Yellow and grey default ellipses: yellow indicates cell initiation Defaults 2010 UTC
Forecaster adjusts convective intensity trend using the pop-up menu for each ellipse Display cell attrbutes including SCIT data trends (meso, hail, WDRAFT, etc.) for cell Convective Trend Options O Intensification O Initiation O Dissipation O No change 2010 UTC
Other considerations • Dave Patrick at PASPC Winnipeg has made extensive revisions to the URP cell tracking algorithm • Bill Burrows at HAL is working on a lightning tracker, so in the future either a blended track could be used, or the forecaster decides which track is best • Similar approaches are being pursued in Australia (TIFS) and France (SIGOONS) • Obvious challenge will be to keep workload reasonable, user interface must be intuitive and fast • Approaches for other seasonal severe weather nowcasting still need to be explored
RSD at PASPC in Edmonton • Beginning in 2006, a desk in strategic location in operational area • RSD focus in Edmonton is on forecasting and nowcasting convective initiation • Experimenting with new convective initiation parameters and indices using full-resolution 1 h GEM data: e.g., mixed moist layer depth, low-level convergence depth, 0-LFC bulk shear Convergence Depth
RSD at PASPC in Edmonton • Experimented with graphic showing meteorological features of interest for convective initiation, and areas where convective initiation is predicted • Accompanied by daily convective initiation discussion addressing con-cepts in more detail http://hal-bobk.edm.ab.ec.gc.ca/RSD.html
Field Experiment Support • Supported the UNSTABLE 2008 convective initiation field study to lee of Alberta Rockies • Communication with field team during briefings • Forecasters had access to special data sets in real time plus preliminary results • Final experimental results disseminated to operations rapidly via the RSD
PASPC Forecaster Survey Results • From survey after 2006 season: • ● those comfortable with a researcher in the operational area grew from 79% to 89% over the season • ● 63% interacted with the RSD occasionally to very often • ● 64% thought the RSD resulted in better watches / warnings • ● 53% thought the RSD provided an enhanced learning environment • ● 84% had a positive overall impression of the RSD • ● 100% would like to see the RSD continue into the future • ● Positive results are similar to those from OSPC
Quantitative Verification • Real-time subjective evaluation of selected existing and new fields will be conducted on RSD against radar, satellite, lightning data • At end of season will verify combined fields via 2x2 contingency table to assess skill in forecasts of CI
Future Plans • Continue to develop and evaluate new NWP-derived fields related to convective initiation and severe storm forecasting / nowcasting • - Will use the results from this work to improve first-guess forecasts of CI in future forecast / nowcast tools • Investigate combining hourly updates of surface fields with GEM NWP data above the surface • - Will serve to provide rapidly updated surface information valuable for storm environment analysis and diagnosis
Summary • The Research Support Desk initiative at Environment Canada seeks to increase collaboration between researchers and forecasters by having researchers work directly and interactively with forecasters in a real-time, operational environment, particularly during severe weather events • A RSD at the OSPC has been active during the summer seasons of 2004-2008, while an RSD at the PAPSC has operated during the summer seasons of 2006-2008 • Surveys of forecasters at both locations have shown strong support for the initiative • It is hoped that the concept will be implemented by the remaining SPCs across Canada
Acknowledgments • Norbert Driedger, Emma Hung, Bob Paterson, Brian Greaves, Bill Burrows and Ron Goodson for technical invaluable assistance with programming and data feeds • Stewart Cober, Ed Becker, Marie McPhee, Gary Burke, Bob Kochtubajda for supporting the initiative • RSD ResMets: Mike Leduc (OSPC 2005, 2007), Yoseph Mengesha (OSPC 2006), Patrick King (2006), Isabel Ruddick (OSPC 2007), Bryan Tugwood (OSPC 2008), Dave Sills (OSPC 2004–2008), and Neil Taylor (PASPC 2006–2008).
References Greaves, B., R. Trafford, N. Driedger, R. Paterson, D. Sills, D. Hudak, and N. Donaldson, 2001: The AURORA Nowcasting Platform – Extending the Concept of a Modifiable Database for Short Range Forecasting. Preprints, 17th International Conference on Interactive Information and Processing Systems for Meteorology, Oceanography, and Hydrology, Albuquerque, NM, Amer. Meteorol. Soc., 236-239.