Download
1 / 26
290 likes | 530 Views
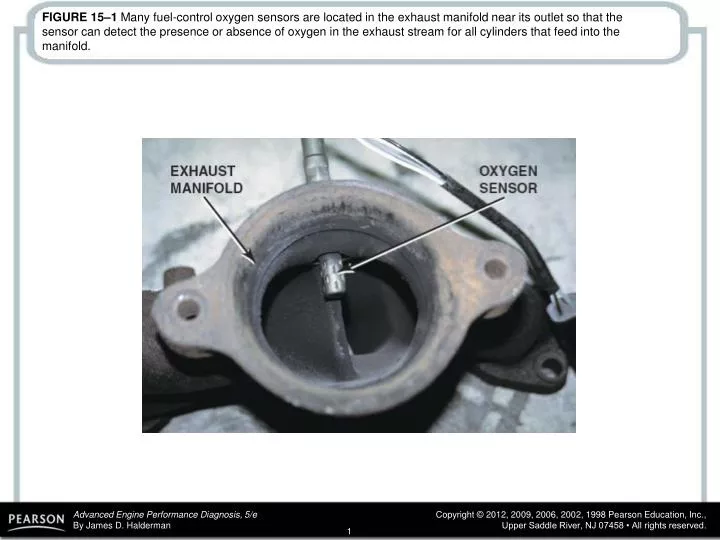
FIGURE 15–1 Many fuel-control oxygen sensors are located in the exhaust manifold near its outlet so that the sensor can detect the presence or absence of oxygen in the exhaust stream for all cylinders that feed into the manifold.

E N D
FIGURE 15–1 Many fuel-control oxygen sensors are located in the exhaust manifold near its outlet so that the sensor can detect the presence or absence of oxygen in the exhaust stream for all cylinders that feed into the manifold.
FIGURE 15–2 A cross-sectional view of a typical zirconia oxygen sensor.
FIGURE 15–3 A difference in oxygen content between the atmosphere and the exhaust gases enables an O2S sensor to generate voltage.
FIGURE 15–4 The oxygen sensor provides a quick response at the stoichiometric air–fuel ratio of 14.7:1.
FIGURE 15–6 Number and label designations for oxygen sensors. Bank 1 is the bank where cylinder number 1 is located.
FIGURE 15–7 The OBD-II catalytic converter monitor compares the signals of the upstream and downstream oxygen sensor to determine converter efficiency.
FIGURE 15–8 Testing an oxygen sensor using a DMM set on DC volts. With the engine operating in closed loop, the oxygen voltage should read over 800 mV and lower than 200 mV and be constantly fluctuating.
FIGURE 15–9 Using a digital multimeter to test an oxygen sensor using the MIN/MAX record function of the meter.
FIGURE 15–10 Connecting a handheld digital storage oscilloscope to an oxygen sensor signal wire. The use of the low-pass filter helps eliminate any low-frequency interference from affecting the scope display.
FIGURE 15–11 The waveform of a good oxygen sensor as displayed on a digital storage oscilloscope (DSO). Note that the maximum reading is above 800 mV and the minimum reading is less than 200 mV.
FIGURE 15–12 A typical good oxygen sensor waveform as displayed on a digital storage oscilloscope. Look for transitions that occur between once every two seconds at idle and five times per second at higher engine speeds (0.5 and 5 Hz). (Courtesy of Fluke Corporation)
FIGURE 15–13 Using the cursors on the oscilloscope, the high- and low-oxygen sensor values can be displayed on the screen. (Courtesy of Fluke Corporation)
FIGURE 15–14 When the air–fuel mixture rapidly changes such as during a rapid acceleration, look for a rapid response. The transition from low to high should be less than 100 ms. (Courtesy of Fluke Corporation)
FIGURE 15–15 Adding propane to the air inlet of an engine operating in closed loop with a working oxygen sensor causes the oxygen sensor voltage to read high.
FIGURE 15–16 When the propane is shut off, the oxygen sensor should read below 200 mV.
FIGURE 15–17 When the O2S voltage rises above 450 mV, the PCM starts to control the fuel mixture based on oxygen sensor activity.
FIGURE 15–18 Normal oxygen sensor frequency is from about one to five times per second.
FIGURE 15–19 Significant hash can be caused by faults in one or more cylinders, whereas amplified hash is not as important for diagnosis.
FIGURE 15–20 Moderate hash may or may not be significant for diagnosis.
FIGURE 15–21 Severe hash is almost always caused by cylinder misfire conditions.
FIGURE 15–22 An ignition- or mixture-related misfire can cause hash on the oxygen sensor waveform.
FIGURE 15–23 An injector imbalance can cause a lean or a rich misfire.
FIGURE 15–24 Negative reading oxygen sensor voltage can be caused by several problems.
FIGURE 15–25 The post-catalytic converter oxygen sensor should display very little activity if the catalytic converter is efficient.
FIGURE 15–26 The target lambda on this vehicle is slightly lower than 1.0 indicating that the PCM is attempting to supply the engine with an air–fuel mixture that is slightly richer than stoichiometric. Multiply the lambda number by 14.7 to find the actual air–fuel ratio.