Download
1 / 27
270 likes | 514 Views
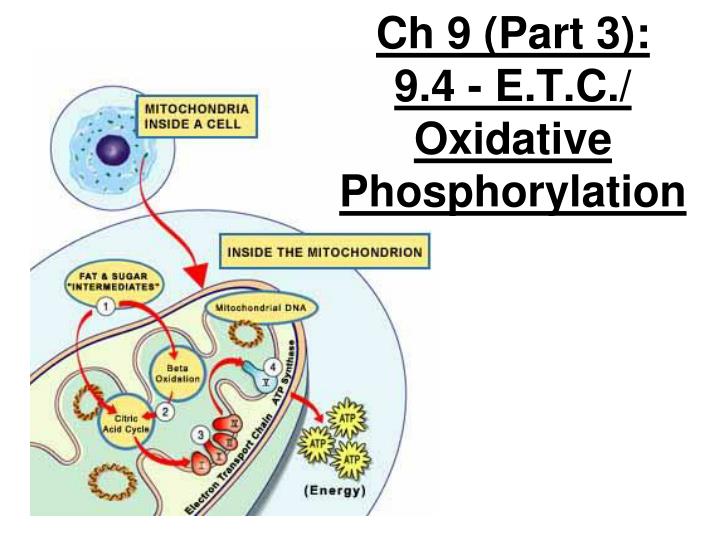
Ch 9 (Part 3): 9.4 - E.T.C./ Oxidative Phosphorylation. ● So far, in glycolysis & the Krebs cycle, 1 glucose molecule has resulted in: 4 ATPs (2 from glycolysis, 2 from Krebs) 10 NADH (2 from gly., 2 from acetyl-CoA step, 6 from Krebs Cycle) 2 FADH 2 (from Krebs Cycle). x2.

E N D
● So far, in glycolysis & the Krebs cycle, 1 glucose molecule has resulted in: 4 ATPs (2 from glycolysis, 2 from Krebs) 10 NADH (2 from gly., 2 from acetyl-CoA step, 6 from Krebs Cycle) 2 FADH2 (from Krebs Cycle) x2
● Following glycolysis and the Krebs cycle, NADH and FADH2 account for most of the energy extracted from food ● These two electron carriers donate electrons to the electron transport chain, which powers ATP synthesis via oxidative phosphorylation
ELECTRON TRANSPORT CHAIN (E.T.C.) ● E.T.C. = a collection of molecules (mostly protein complexes) embedded in the inner membrane of mitochondrion (foldings of inner membrane form CRISTAE)
The Pathway of Electron Transport ● the groups along the chain alternate between reduced & oxidized states as they accept and donate electrons ● each successive group is more electronegative than the group before it, so the electrons are “pulled downhill” towards OXYGEN (the final electron carrier!)
NADH 50 FADH2 Multiprotein complexes I FAD 40 FMN II Fe•S Fe•S Q III Cyt b Oxidative phosphorylation: electron transport and chemiosmosis Citric acid cycle Glycolysis Fe•S 30 Cyt c1 IV Free energy (G) relative to O2 (kcal/mol) Cyt c ATP ATP ATP Cyt a Cyt a3 20 10 2 H+ + 1/2 O2 0 H2O
● as molecular oxygen (O2) is reduced, it also picks up H+ from the environment to form water (H2O)
ATP Production of the E.T.C. Typically, the ATP produced is as follows: 1 NADH 3 ATP 1 FADH2 2 ATP (FADH2 is “dropped off” at a lower point in the E.T.C., so it generates fewer ATPs) “exchange rate”
Chemiosmosis: The Energy-Coupling Mechanism ● Electron transfer in the electron transport chain causes proteins to pump H+ from the mitochondrial matrix to the intermembrane space (active transport) ● H+ (protons) then move back across the membrane, passing through channels in ATP synthase
Chemiosmosis: The Energy-Coupling Mechanism ● ATP synthase uses the exergonic flow of H+ to drive phosphorylation of ATP ● This is an example of CHEMIOSMOSIS, the use of energy in a H+ gradient to drive cellular work
● The energy stored in a H+ gradient across a membrane couples the redox reactions of the electron transport chain to ATP synthesis ● The H+ gradient is referred to as a PROTON-MOTIVE FORCE, emphasizing its capacity to do work
(inner matrix) ● protons then diffuse back across the membrane through the ATP synthase complex which causes the phosphorylation of ADP to form ATP! (intermembrane space)
INTERMEMBRANE SPACE A rotor within the membrane spins as shown when H+ flows past it down the H+ gradient. H+ H+ H+ H+ H+ H+ H+ A stator anchored in the membrane holds the knob stationary. A rod (or “stalk”) extending into the knob also spins, activating catalytic sites in the knob. H+ Three catalytic sites in the stationary knob join inorganic phosphate to ADP to make ATP. ADP + ATP P i MITOCHONDRAL MATRIX
Inner mitochondrial membrane Oxidative phosphorylation: electron transport and chemiosmosis Citric acid cycle Glycolysis ATP ATP ATP H+ H+ H+ H+ Cyt c Protein complex of electron carriers Intermembrane space Q IV III I ATP synthase II Inner mitochondrial membrane H2O 2H+ + 1/2 O2 FADH2 FAD NAD+ NADH + H+ ATP ADP + P i (carrying electrons from food) H+ Mitochondrial matrix Electron transport chain Electron transport and pumping of protons (H+), Which create an H+ gradient across the membrane Chemiosmosis ATP synthesis powered by the flow of H+ back across the membrane Oxidative phosphorylation
SUMMARY: ● most energy flows in this sequence: Glucose NADH E.T.C. proton ATP motive force
PROCESS ATP produced by subs. phos. Reduced coenz. ATP produced by oxid. phos. (in the E.T.C.) TOTAL ATPs Glycolysis 2 ATP 2 NADH (go to ETC) 4-6 ATP 6-8 oxid. of pyruvate to acetyl CoA 2 NADH (go to ETC) 6 ATP 6 Krebs cycle 2 ATP 6 NADH 2 FADH2 (go to ETC) 18 ATP 4 ATP 24 TOTAL ATPs 36-38!
● approximately 40% of energy in glucose is converted to ATP ●the remaining energy is lost as heat
Electron shuttles span membrane MITOCHONDRION CYTOSOL 2 NADH or 2 FADH2 2 NADH 2 NADH 6 NADH 2 FADH2 Oxidative phosphorylation: electron transport and chemiosmosis Glycolysis 2 Acetyl CoA Citric acid cycle 2 Pyruvate Glucose + 2 ATP + 2 ATP + about 32 or 34 ATP by substrate-level phosphorylation by substrate-level phosphorylation by oxidation phosphorylation, depending on which shuttle transports electrons form NADH in cytosol About 36 or 38 ATP Maximum per glucose: **actual ATP total’s are slightly less – when we factor in “real” exchange rates and the energetic cost of moving the ATP formed in the mitochondrion out into the cytosol, where it will be used**