Download
1 / 15
150 likes | 272 Views
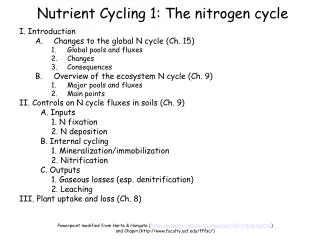
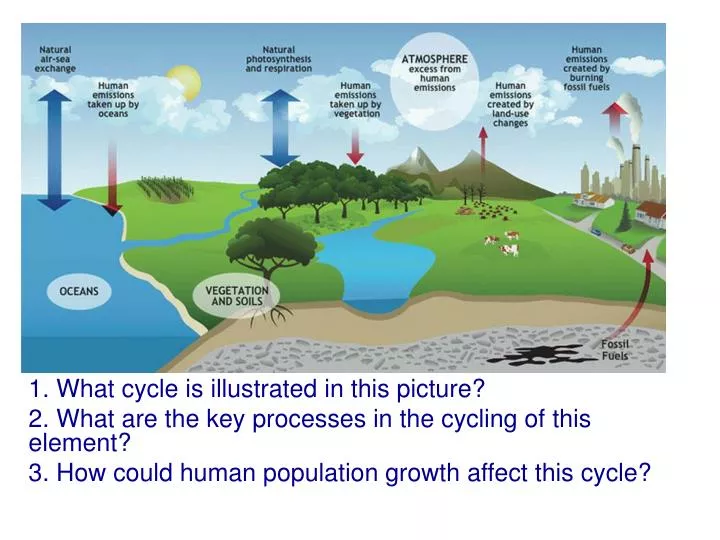
1. What cycle is illustrated in this picture? 2. What are the key processes in the cycling of this element? 3. How could human population growth affect this cycle?. Population Growth Patterns and Ecological Succession.

E N D
1. What cycle is illustrated in this picture? 2. What are the key processes in the cycling of this element? 3. How could human population growth affect this cycle?
Population Growth Patterns and Ecological Succession • Population density is expressed as a ratio that describes a direct relationship between two quantities. • What do you think the relationship for calculating population density is? # of individuals Area they occupy = population density
Population Density • Ex: If scientists sampling a population of deer counted 200 individuals in an area of 10 square kilometers, what would the density be? • 20 deer/square km • What might a decrease in the density of a deer population over a specific time period tell scientists about the habitat in the area? • Resources might be depleted, the community may have changed due to factors such as a new predator
Population Dispersion Patterns • How might individuals of a population be dispersed throughout their habitats? • What dispersion pattern is displayed in our classroom? • What dispersion pattern is displayed in the cafeteria?
http://video.nationalgeographic.com/video/animals/mammals-animals/bats/weirdest-bats-swarm-survive/http://video.nationalgeographic.com/video/animals/mammals-animals/bats/weirdest-bats-swarm-survive/ • This satellite photo shows the uniform distribution of termite mounds in Africa’s Savanna • Each mound stands at the center of floral productivity • The highly regular spatial pattern of fertile mounds generated by termites increases overall levels of ecosystem production • Termites bring coarse particles into the fine soil. The coarse particles allow water to infiltrate the soil. Also, elevated levels of nitrogen and phosphorus were found to be associated near the mounds
Survivorship Curves • What does a survivorship curve show? • # of surviving members over time • How might it explain the reproductive strategies of a species? • Large amount of offspring, few survive / smaller amount of offspring- more parental care
Population Growth Patterns • Immigration • Movement of individuals into a population from another population • Emigration • Movement of individuals out of a population and into another population
Logistic Growth Exponential Growth Population growth is a function of the environment The rate of growth is determined by the amount of resources available What determines population growth?
Other Factors that Affect Population Growth • Carrying Capacity • The maximum number of individuals of a particular species that the environment can consistently support • When could carrying capacity change? • When the environment changes • What is the carrying capacity of humans? • It depends on how we use our resources
What factors affect the carrying capacity of an environment for a population? • Limiting Factors • Density-Dependent Limiting factors • Factors affected by the number of individuals in a given area • Competition • Predation • Parasitism/Disease • Density-Independent limiting factor • Environmental factors that limit a population’s growth regardless of the density • Unusual weather • Natural disasters • Human activities
What is Earth’s Carrying Capacity? • http://www.youtube.com/watch?v=sc4HxPxNrZ0
Ecological Succession • From clean to cluttered • A gradual process
Ecological Succession • After an ecosystem experiences a catastrophe and begins to re-grow, the space re-forms itself through “succession” • Succession = the sequence of biotic changes that regenerate a damaged community or create a community in a previously uninhabited area
Ecological Succession • Primary Succession • Establishment & development of an ecosystem in a previously uninhabited area • Ex: Glacier Bay National Park in Alaska- as glaciers recede, primary succession is observed • Begins with bare rock • “Pioneer species” are the first organisms to live in this previously uninhabited area • Typically lichens and mosses • Secondary Succession • Reestablishment of a damaged ecosystem where soil remains intact
Secondary Succession as a result of Fires • The Fire of 1910 • Largest forest fire in American history • Burned 3 million acres across 3 states- Washington, Idaho, Montana • Almost as large as the state of Connecticut • Hot and dry summer led to 1,000 to 3,000 fires burning across these states in August • August 20th- cold front blows in and brings “hurricane” winds that turn thousands of fires into one or two “blazing infernos” • Many towns were completely destroyed by the fire • The U.S. Forest Service was shaped after this fire