Download
1 / 54
540 likes | 547 Views
hydro-acoustic signal and tsunami wave generated by sea floor motion. Chierici, F., L. Pignagnoli, and D. Embriaco, (2009), Modelling of the hydro-acoustic signal and tsunami wave generated by sea floor motion including a porous seabed , J. Geophys.Res., doi:10.1029/2009JC005522, in press.

E N D
hydro-acoustic signal and tsunami wave generated by sea floor motion Chierici, F., L. Pignagnoli, and D. Embriaco, (2009), Modelling of the hydro-acoustic signal and tsunami wave generated by sea floor motion including a porous seabed, J. Geophys.Res., doi:10.1029/2009JC005522, in press.
NEAREST(coordinator: dr. Zitellini, ISMAR – CNR) Integrated observation from NEAR shore sourcES of Tsunamis: toward an early warning system EC Project (FP6, 2006-2009) http://nearest.bo.ismar.cnr.it ISMAR-CNR, Italy University of Lisbon, Portugal Consejo Superior de Investigaciones Cientificas, Spain Alfred Wegener Institut, Germany University of West Bretagne, France INGV, Italy Technische Fachhochschule-Berlin, Germany Istituto Andaluz de Geofisica, Spain Istituto de Meteorologia, Portugal Centre National pour la Recherche Scientif. etTechn., Morocco XISTOS Development S.A., France
Main objectives • AREA of interest: Gulf of Cadiz (Atlantic Ocean), source of 1755 Tsunami which destroyed Lisbon and the coasts of South Portugal, Spain and Morocco. • Near field and near shore tsunami generation problem: the abyssal observatory GEOSTAR is located in an active seismic zone. • Tsunami warning system: real time pressure data analysis is performed on the seafloor and a two way communication link with the on-shore network was setup. • Quick response time: only few minutes for a generated tsunami to reach the nearest coast. Portugal Spain GEOSTAR
Outline 1) A innovative Tsunameter have been developed in the Framework of NEAREST project (it will be installed on board SN1 abyssal station. A new software for the remote control of the tsunameter and of SN1 abyssal station has been designed and implemented). 2) A new model and relative results of tsunami generation in compressible water column overlying a porous sea bed (extended)
A new tsunami detector prototype, able to operate in generation areas , has been developed and operated successfully for 1 year at 3200 m depth
Tsunami Detection Procedure • Trigger on Pressure and Seismic events • Seismometer: trigger on strong seismic event (STA/LTA) • Pressure: for the detection of sea level anomalies (Tsunamis wave); TDA declares the event on processed sea level data testing them against a prescribed threshold
A new real-time tsunami detection algorithm , based on localization concept (de-tide and filtering) has been developed and operated successfully from september 2007 to august 2008 in the Gulf of Cadiz
Noisy data: d165_2001-ed.dat ~2m. 3.B Low Pass like Filtering ~2cm. 2.(A & B) Spikes Removing (zoom) 4.B difference between Newton Linear Predicted and Filtered Signal ~4cm. Pressure Sensor Accelerometer Correction for pressure sensor motion 3.A Band Pass like Filtering • 1.(A & B) Tides Removal Algorithm A (A & B) TSUNAMI DETECTED ! ~10cm. Algorithm B
New real-time Tsunami Detection Algorithm (site adaptivity, high reliability and accuracy, low computational cost) Pressure data acquired every 15 s. (Paroscientific 8CB4000) Real time Algorithm Tide removal Spike removal Low pass + Prediction algorithm (Newton linear predictor) or Band Pass like filter All parameters can be reconfigured Tsunami 200cm 100 hours 2cm 2 hours Pressure Raw data Processeddata
Example of pressure signal recorded during Aug 2007 – Aug 2008NEAREST mission (1cm H2O ~ 1mBar) 2 days 40 cm 3 m 2 cm 2 h 1 month
A new tsunami generation model has been developed that use the water compressibility coupled with porous sediment
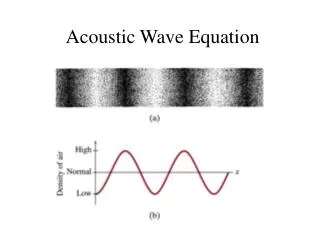
MODEL FOR TUSNAMI GENERATION 1) 2-D model of tsunami generation in compressible water column overlying a porous sea bed 2) Results, in particular concerning the acoustic wave induced within the water column by the sea floor motion 3) Application to Real Case: Tokachi-Oki 2003 Event
1. MODEL 2-D Vertical X-Z frame of reference z x h WATER COLUMN hs POROUS SEDIMENT
Assumptions 1) Small Amplitude waves: the wave amplitude x is negligible with respect to the wavelength. x/h << 1. Kinetic Energy << Potential Energy 2) No Sea Water Viscosity => (Potential Flow)
in WATER COLUMN we use Navier-Stokes equations for a compressible fluid intoSEDIMENT we use Darcy equations for porous medium
EQUATIONS OF MOTION: Sea Water Column: Mass Conservation Linearized Bernoulli equation c is the sound speed
BOUNDARY CONDITIONS: Free Surface (z = 0): Linearised Bernoulli equation Kinematic condition
BOUNDARY CONDITIONS: Sea Water – Sediment Bed interface (z = -h): Stress Continuity Vertical velocity continuity
BOUNDARY CONDITIONS: SedimentBottom : Non-permeability condition η(t) is the sea floor displacement (η/ h << 1) We use and combine different kind of sea floor motions: duration, phase, amplitude and different motion are employed together in order to obtain a wide typology of sea floor motion.
Basic Sea Floor Motions (each motion can be either negative or positive polarized and due to linearity they can be composed with different periods, amplitudes and phases): Time Space Permanent Displacement + Positive Elastic Motion (no permanent displacement) + Elastic Oscillation (no permanent displacement)
The sea floor elastic motion can be obtained combining permanent displacement with time-shift operator + The pressure field at fixed depth can be easily related to the free surface solution (transfer function) + The solution, corresponding to the elastic motion can be easily related to the one obtained for the permanent displacement. Hence it is sufficient to solve the problem for the free surface and permanent displacement only
Semi-Analytical Solution by transforming x spatial variable with Fourier and t time variable with Laplace
where with k wave number and ω angular velocity A(ω, k), B(ω, k), C(ω, k) and D(ω, k) are the functions obtained imposing the boundary conditions. For example B is given by the following espression and
Model of Sea Floor Permanent Displacement Fourier (x => K) + Laplace (t => ω) τ: time duration of the sea floor motion η0: amplitude of the sea floor motion a: half-length of the source area
Transfer function (in the Fourier – Laplace space): Pressure at depth z Free Surface (z = 0)
2. RESULTS • The solved model allows us to study: • Thepressure and velocity fields (in the water column and in the porous sediment) • The free surface signal(from the velocity vertical component at the air-water interface) • at different distances from the source.
In this model, the sea floor motion causes a modulated hydro acoustic wave
Free surface plot at 100km (a), 200km(b), 300km (c) and 1000km (d) distance from the source. η0 = 1m. a = 60 km. τ= 25 sec. h = 3 km. hs = 1.5 km. n = 0.3 kp = 10-6 cm2
Hydro-acoustic signal with its modulation
We found that this wave, travelling much faster than tsunami wave, can propagate far outside the source area and carries information about source main parameters as velocity, amplitude and extension of the source area
Free surface plot at 300 km. from the source for different source length: 30km (a), 60km(b), 90km (c) η0 = 1m. τ= 25 sec. h = 1.5 km. hs = 0.75 km. n = 0.3 kp = 10-6 cm2
Free surface plot at 300 km. from the source for different source velocity: 1 m/s (a), 0.2 m/s (b), 0.1 m/s (c) η0 = 1m. h = 1.5 km. hs = 0.75 km. n = 0.3 kp = 10-6 cm2
“INTERFERING” CASE: Free surface plot for different source time duration: 4 s (a), 8 s (b), 12 s (c) , 16 s (d) τ= n (4h/c) n = 1,2,… η0 = 1m. h = 1.5 km. hs = 0.75 km. n = 0.3 kp = 10-6 cm2
INTERFERING CASE: Comparison ofModulation Pulse Slope
Within the frame of a compressible model the energy transmitted to the water layer by bottom motion is: In a 2-D Model we can rewrite: The mean slope is effectively an indicator of the energy released by the bottom motion into the water layer
In other word this modulated acoustic signal can be regarded as tsunami precursor and it could be used in new tsunami early warning systems!
Non seismictsunamigenicsubmarine landslide could also produce hydro acoustic waves
CONSIDERATIONS 1) The source information carried by the acoustic wave is present in the very first pulses. 2) In this sense the modulated acoustic waves act like a Tsunami precursor !!! and could be used for Tsunami Early Warning purpose 3) The porous sediment acts as low pass filter 4) Darcy equation does not consider compressibility in the sediment
Two layer model To consider the effect of sediment compressibility the porous sediment is treated as fluid-like, homogeneous and isotropic medium. The sediment effective viscosity, take into accountinter-granular friction within the sediment itself.(Buckingham 1998)
Motion Equations: Sea Water Column: Sediment (Viscousfluid): With the same boundary conditions
Nosov 2007 3-D rigid bottom model MISMATCH between measurement and model results !
Two layer model vs Darcy sediment Model
CONCLUSIONS 1) Main effects of the porous layer: a) low-pass filtering of the signals and b) attenuation of the signal: 2) The compressible porous sediment changes the power spectrum distribution of the hydro-acoustic wave. 3) The acoustic signal generated by the sea-floor motion, reaches the observation points much earlier than the possible tsunami wave.
CONCLUSIONS 4) The acoustic signal carries information as to sea floor motion 5) These information can be extracted from the signal just from the very first pulses arrival. 6) Interference does not erase the source motion information contained in the acoustic signal 7) The acoustic signal shows a low attenuation in amplitude also at long distance from the source.
If detected these hydro-acoustic waves can lead to the design of a new tsunami early warning system based on tsunami precursors
OνDE hydro-acoustic antennas equipped with suitable low frequency hydrophones might be a good candidate for the detector and for the basic element of a possible hydro-acoustic tsunami early warning system