Download

1 / 30
320 likes | 795 Views
Mark recapture lecture 2: Jolly-Seber Confidence intervals. Jolly-Seber For an OPEN population Repeatedly sampled Information on when an individual was last marked. LPB Colony size. Year. Open populations. Individuals enter or leave the population between surveys. Survey 2.

E N D
Mark recapture lecture 2: • Jolly-Seber • Confidence intervals
Jolly-Seber • For an OPEN population • Repeatedly sampled • Information on when an individual was last marked LPB Colony size Year
Open populations Individuals enter or leave the population between surveys Survey 2 Survey 1
Catch nt animals Check if each animal is marked Total unmarked (ut) Total marked (mt) Mark all with code for this time period Release St (equals nt if no handling mortality) NO YES Question: What is formula for proportion marked?
Jolly-Seber Remember Petersen (biased): N= C M R
Problem: We don’t know how many marked in population (M) Sample 1: mark 21 animals Sample 2: mark 41 animals Sample 3: mark 46 animals How many marked at beginning of sample 4? Not 21+41+46=108, as some will have died or emigrated
Time 1 Time 2 Time 3 Mark 3, but 1 of these emigrates Mark 2 more, no loss of marked animals Mark 3 more, but 1 marked animal dies
Time 4 How many marked animals are alive and present in the population at time 4? Marked animals in sample 4 (m4) = 3 + Marked animals not in sample 4 =Total number of marked animals in population
Time 4 Marked animals in sample 4 (m4) = 3 + Marked animals not in sample 4 =Total number of marked animals in population 6 marked at end of time 4 (S4)
Time 4 Time 5 Marked animals in sample 4 (m4) = 3 + Marked animals not in sample 4 =Total number of marked animals in population 6 marked at end of time 4 (S4)
Time 4 Time 5 Marked animals in sample 4 (m4) = 3 + Marked animals not in sample 4 (> 1) =Total number of marked animals in population 6 marked at time 4 (S4), recaptured (R4)=1
Time 4 Time 5 Marked animals in sample 4 (m4) = 3 + Marked animals not in sample 4 (> 1) =Total number of marked animals in population 6 marked at time 4 (S4), recaptured (R4)=1
Time 4 Time 5 Time 6 Marked animals in sample 4 (m4) = 3 + Marked animals not in sample 4 (> 1) =Total number of marked animals in population 6 marked at time 4 (S4), recaptured (R4)=1+1
Marked animals in sample 4 (m4) = 3 + Marked animals not in sample 4 (> 1) =Total number of marked animals in population 6 marked at time 4 (S4), recaptured (R4)=1+1
Marked animals alive but not found in sample 4 = Recaptures after sample 4 (Z4=1) x factor accounting for animals missed or lost from population Marked animals in sample 4 (m4) = 3 + Marked animals not in sample 4 (> 1) =Total number of marked animals in population 6 marked at time 4 (S4), recaptured (R4)=1+1
Marked animals alive but not found in sample 4 = Recaptures after sample 4 (Z4=1) x factor accounting for animals missed or lost from population (S4 / R4) = 6/2 = 3 Marked animals in sample 4 (m4) = 3 + Marked animals not in sample 4 (> 1) =Total number of marked animals in population 6 marked at time 4 (S4), recaptured (R4)=1+1
Marked animals alive but not found in sample 4 = Z4 * S4 = 1* 6 = 3 R42 Marked animals in sample 4 (m4) = 3 + Marked animals not in sample 4 (=3) =Total number of marked animals in population (M4 = 6)
Biased formula for number of marked animals in population: Mt= mt + Zt * St Rt
Biased formula for number of marked animals in population: Mt= mt + Zt * St Rt Unbiased formula for number of marked animals in population: Mt= mt + Zt * (St+ 1) (Rt + 1)
Jolly-Seber Remember Petersen (biased): N= C M R Rearrange to: N = M (R/C) Number marked in population Proportion marked in sample
Jolly-Seber Nt = Mt (?) Number marked in population (t) Proportion marked in sample t
Catch nt animals Check if each animal is marked Total unmarked (ut) Total marked (mt) Mark all with code for this time period Release St (equals nt if no handling mortality) NO YES
Jolly-Seber Nt = Mt (?) mt nt mt +1 nt + 1 ? = ? (unbiased) = Number marked in population Proportion marked in sample
Question: m5 = 21 S5 = 9 R5 = 4 Z5 = 10 n5 = 43 What is N? M5 = 21 + 10*(9+1) = 21+20 = 41 (4+1) Proportion marked in sample = (21+1) = 0.5 (43+1) N5 = 41/0.5 = 82
Confidence intervals • A range around the estimate of a parameter which • if repeated – • would include the true value of the parameter a certain percentage of the time ( )
( ) ( ) ( ) ( ) ( ) ( ) ( ) ( ) ( ) ( ) ( ) ( ) ( ) ( ) ( ) ( ) ( ) ( ) ( ) ( ) 95% Confidence interval: 19/20 of these confidence intervals contain the true value true value
Example of 95% confidence intervals: 501 British Columbians: “Which party would you vote for in the next provincial election?”: CI = ± 4.5%
Difference between confidence interval and variance: Variance: know distribution of MANY data points around estimate (mean) Eg. We measured height of 500 British Columbians (1.4 m + 0.2 m) Confidence interval: only have ONE parameter estimate, have to guess what the distribution of repeated measurements might look like Eg. We obtained percentage of British Columbians who “disapprove of Campbell’s performance”, and estimated CI (51% + 4.5%)
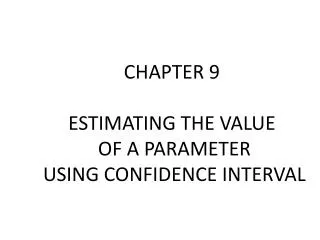
Step 1: Make an educated guess as to the distribution (p 22 Krebs) Y Petersen Is the ratio of R/C > 0.10? Binomial Is the number of recaptures, R > 50? Schnabel Y Normal Schumacher- Eschmeyer Poisson Jolly-Seber: complex lognormal assumed, See Krebs p 47
Step 2: Calculate CI for either R or R/C (as appropriate) -see formulae in Krebs Step 3: Insert upper and lower bound for R or R/C into the formula for estimating population size to obtain CI For example, if CI for R/C is (0.083, 0.177), to calculate CI for N by Petersen: N=M/ 0.083 (upper bound) N=M/ 0.177 (lower bound)