Download
1 / 10
100 likes | 259 Views
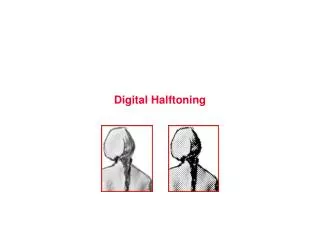
New Technologies for Probing the Diversity of Brown Dwarfs and Exoplanets – Shanghai 2009. Halftoning for High-Contrast Imaging. P. Martinez 1 C. Dorrer 2 , E. Aller Carpentier 1 , M. Kasper 1 , A. Boccaletti 3 , and K. Dohlen 4 1 European Southern Observatory 2 Aktiwave – Rochester N.Y

E N D
New Technologies for Probing the Diversity of Brown Dwarfs and Exoplanets – Shanghai 2009 Halftoning for High-Contrast Imaging P. Martinez1 C. Dorrer2, E. Aller Carpentier1, M. Kasper1, A. Boccaletti3, and K. Dohlen4 1European Southern Observatory 2Aktiwave – Rochester N.Y 3LESIA – Paris Observatory 4LAM – Marseille Observatory This activity is supported by the European Community under its Framework Programme 6, ELT design study.
Halftoning principle & key parameters • Components are based on metallic micro-dots to generate spatially-varying transmission • displaying continuous-tonefilters with only black (opaque) and white (transparent) dots Free-space propagation Image from Dorrer et al. 2007, JOSA dot => 0% transmission (substrate + opaque metal) no dot => 100% transmission (substrate only) • Key parameters (application-dependent) • shapeof the dots (square, hexagone…) • size of the dots [p], i.e. sampling problem (p >) • metal layer (Cr, Al…) • opticaldensity, i.e. opacity of the dots, OD() • algorithm used for dots distribution Impact the power spectrum of a microdot filter
Halftoning for coronagraphy Apodized Pupil Lyot Coronagraph, APLC (Soummer et al., A&A 2003) (Idem for conventional pupil apodization coronagraph or Dual Zone coronagraph) Band-Limited coronagraph, BL (Kuchner et Traub, ApJ 2002) (see talk of M. Kuchner this afternoon)
Diffraction stray-light: APLC pupil apodizer • The smaller the dots are, the better the transmission profile matches the desired one • (i.e. sampling problem, S =pupil diameter / dot size) • The APLC coronagraphic image is affected by: • Deterministic effect: diffraction peaks (dot scatters light) • Stochastic effect: speckles will border diffraction peaks (dots distribution is not regular) • theoretical derivations in Martinez et al. 2009a, A&A 495 Laboratory validation (Martinez et al. 2009b, A&A 500) 15 microns 30 microns 60 microns 120 microns 240 microns Dot size (μm) S = 200 S = 100 S = 50 S = 25 S = 12.5 Pupil plane (3mm) prototypes APLC coronagraphic images 1.2”
Diffraction stray-light: BL focal plane mask Ψpupil plane = [ FT( Mask BL) ✪ pupil ] ✖ pupil-stop Ideal mask Microdot mask Numerical noise Metric: s = (F#xλmin) / pFurther details in Martinez et al. 2009c, ApJ submitted Contrast 10-8 (IWA) to 10-10 Ok if IWA > 3 λ/D
Final prototype: APLC pupil apodizer Filter shape: Prolate-like function Diameter pattern: 3 mm Metal layer: Cr OD 4(standard) Dot size: 4.5 microns S = 660 Local profile accuracy: 3% (new proto => 2%) Achromaticity transmission 1% (J and H-band)
Final prototype: BL focal plane mask Filter shape: 1 - sinc Diameter pattern: 10 mm Material layer: Al OD 8+ in near-IR Dot size: 5 microns s = 16 Local profile accuracy: ~ 5% (new proto => 3%)
Δλ/λ = 1.4% APLC & BL laboratory tests Δλ/λ = 24% APLC laboratory tests Band-Limited laboratory tests H-band Δλ/λ = 24% Laboratory experiment demonstrate correct behavior of the coronagraphs
XAO APLClaboratory test on HOT PSF APLC High-Pass Filtered APLC • The High-Order Testbench (HOT) • AO bench developed at ESO • (Aller Carpentier et al., 2008 SPIE) • Seeing: 0.5” • DM: 31 x 31 actuators • AO cut-off frequency: 15 λ/D (0.6”) • APLC Contrast 5σ (HPF): • 2.5 10-4 @ 0.1” • 2.2 10-5 @ 0.5” • see poster: XAO coronagraphy with HOT
Conclusion • It works: APLC and BLs using halftoning demonstrate correct behavior • Laboratory limitations originate from external error sources • Accurate • Achromatic • Reproducible • Cheep : 2-3k€ • Validated for the APLC on the SPHERE (VLT) & GPI (Gemini) instruments • Baseline for EPICS (E-ELT) • Not only for coronagraphy • (e.g. Laser beam shaping: Dorrer et al. 2007, JOSA – B, vol. 24)