Download
1 / 70
710 likes | 924 Views
HER2 Positive Breast Cancer. Charles E. Geyer, Jr. MD, FACP Professor of Medicine Division of Hematology, Oncology and Palliative Care Virginia Commonwealth University Associate Director of Clinical Research Massey Cancer Center Heme/Onc Fellows Lecture Series November 1, 2016.

E N D
HER2 Positive Breast Cancer Charles E. Geyer, Jr. MD, FACP Professor of Medicine Division of Hematology, Oncology and Palliative Care Virginia Commonwealth University Associate Director of Clinical Research Massey Cancer Center Heme/Onc Fellows Lecture Series November 1, 2016
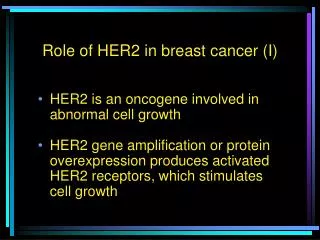
HER2/Neu Oncogene Discovery 1Schecter AL et al. Nature 1984;312:513-516 2King CR et al. Science 1985;229:974-976 3Coussens L et al. Science 1985;230:1132-1139 4Bargmann CI et al. Cell 1986;45:649-657 5Slamon DJ et al. Science 1987; 237:177-182 1984: Neu transforming gene identified in chemically induced rat neuro-glioblastoma1 1985: HER2 amplification identified in human breast cancer2 1985: HER2 and c-erbB2 identified and found to be the same gene as neu3 1986: Neu oncogene had activating point mutation in transmembrane domain4 1987: HER2/neu amplification associated with worse prognosis in operable breast cancer5
HRG (NRG1) HB-EGF -cel Epi EGF HB-GF Amp TGF NRG1 NRG2 Epi NRG3 NRG4 HER Family Receptors and Ligands Ligand binding domain Transmembrane Tyrosine kinase domain HER1/ EGFR HER3 HER4 HER2 Herbst. Int J Radiat Oncol Biol Phys. 2004;59(suppl):21 Roskoski. Biochem Biophys Res Commun. 2004;319:1; Rowinsky. Annu Rev Med. 2004;55:433
HER Family Ligand Binding, Dimerization, and Phosphorylation EGF HER1(Open) HER1(Closed) HER2(Open) Dimerization EGF Activation of Downstream Signaling Phosphorylation Roskoski. Biochem Biophys Res Commun. 2004;319:1; Herbst. Int J Radiat Oncol Biol Phys. 2004;59(suppl):21
Hierarchy of HER2 Family Dimer Formationand Signal Potency ErbB-1 ErbB-1 HER2 Heterodimers Homodimers ErbB-1 ErbB-3 ErbB-2 ErbB-1 ErbB-1 ErbB-2 ErbB-4 ErbB-2 ErbB-3 ErbB-3 ErbB-4 ErbB-4 ErbB-3 ErbB-3 ErbB-2 ErbB-4 ErbB-4 ErbB-2 Strongest Weakest Holbro T and Hynes N. Annu Rev Pharmacol Toxicol. 2004;44:195-217 Harari D and Yarden Y. Oncogene. 2000;19:6102-6114 Rowinsky E. Horizons in Cancer Therapies: From Bench to Bedside. 2001;2:3-35
HER Family Heterodimer Signaling Pathways Grb2 Sos Ras Shc Grb2 Sos Raf PI3K Akt MEK1/2 PTEN mTOR GSK3 FKHR MAPK BAD p27 Proliferation Cyclin D1, E Survival Cell-cycle progression
ASCO-CAP Guidelines Definitions of HER2 Status Wolff AC et al. J ClinOncol. 2013:31; 3997-4013 Wolff AC et al. J Clin Oncol. 2006:25;118-145
Intrinsic Subtypes of Breast Cancer Unsupervised Hierarchical Clustering Analysis Perou CM. The Oncologist 2011:16(suppl 1):61-70
ER and HER2 Status within Intrinsic Subtypes Eroles P et at. Cancer Treatment Reviews 2012:38:698-707
ER and HER2 Status within Intrinsic Subtypes Eroles P et at. Cancer Treatment Reviews 2012:38:698-707
Chemotherapy plus Trastuzumab in MBC that Overexpresses HER2 Median survival 25.1 months vs 20.3 months (P=0.046) Median TTP 7.4 months vs 4.6 months (P<0.001) Slamon DJ et al. NEJM 344: 2001;784-792
Trastuzumab with Chemotherapy as First-line Therapy for Metastatic Disease * N/P = Not Provided 1 Slamon DJ et al. N Engl J Med 2001;344:783-792 2 Marty M et al. J Clin Oncol 2005;23:4265-4274 3 Burstein HJ et al. J Clin Oncol 2003;21:2889-2895
GBG 26 / BIG-05: Trastuzumab/Capecitabine vs. Capecitabine in Breast Cancer Progressing during Trastuzumab Eligibility criteria: • Progressive MBC or LABC • HER2 positive • Patients randomized: 156 • Prior therapies : 1st line metastatic setting: T + taxane 111 T ± non-taxane 42 Adjuvant: T + taxane 3 • Prior anthracyclines 75 • Visceral metastases 119 Trastuzumab (T) 6 mg/kg day 1 q 21 days Capecitabine2500 mg/m2/day, days 1-14, q 21 days RANDOMIZE Capecitabine2500 mg/m2/day days 1-14, q 21 days Primary endpoint: TTP Secondary endpoints: OS, ORR, CB Von Minckwitz G, et al. J Clin Oncol 2009; 27:1999-2006
GBG 26 / BIG 3 – 05 Capecitabine vs. Capecitabine + Trastuzumab(median follow-up 15.6 months)(accrual closed with registration of lapatinib) Von Minckwitz G, et al. J Clin Oncol 2009; 27:1999-2006
Lapatinib 1+1 2+2 1+2 Lapatinib Mechanism of Action • Oral dual-tyrosine kinase inhibitor with specificity for the EGFR and HER2 receptors • Binds reversibly to the cytoplasmic ATP-binding site of the kinases, preventing receptor phosphorylation and activation • Blocks downstream signaling through homodimers and heterodimers of EGFR and HER2 Downstream signaling cascade Rusnak et al. Mol Cancer Ther 2001;1:85-94 Xia et al. Oncogene 2002;21:6255-6263 Konecny et al. Cancer Res 2006;66:1630-1639
BT474 Lapatinib Non-Cross Resistance with Trastuzumab Traztuzumab 100 BT474 conditioned 90 80 70 60 50 percent Cell viability 40 Lapatinib 30 BT474 conditioned 20 BT474 10 0 0.016 0.031 0.066 0.125 0.25 0.5 1 2 4 µg/ml Traztuzumab 3.9 7.8 15.6 31.3 62.5 125 250 500 1000 nM Lapatinib Activity of lapatinib in HER2-overexpressing cells selected for long-term growth in the presence of 100ug/mL trastuzumab Konecny, Pegram, et al., Cancer Res 2006;66:1630-9
Comparison with Trastuzumab Activity 1 Vogel et al J Clin Oncol 2002;20:719-726 2 Baselga et al J Clin Oncol 2005;23:2162-2171 3Gomez et al J Clin Oncol 2008;26:2999-3005
EGF100151 Study Design N=324 • Progressive, HER2+ MBC or LABC • Previously treated with anthracycline, taxane and trastuzumab* • No prior capecitabine • Measurable disease by RECIST • LVEF ≥ institution LLN RANDOMIZATION Lapatinib 1250 mg poqd continuously + Capecitabine 2000 mg/m2/d po days 1-14 q 3 wk Capecitabine 2500 mg/m2/d podays 1-14 q 3 wk Stratification: • Disease sites • Stage of disease Patients on treatment until progression or unacceptable toxicity, then followed for survival *Trastuzumab must have been administered for metastatic disease Geyer et al. NEJM 2006;355:2733-2743
Lapatinib + Capecitabine Capecitabine No. of pts 163 161 Progressed or died 49 72 90 Median TTP, mo 4.4 8.4 80 Hazard ratio (95% CI) 0.49 (0.34, 0.71) 70 P-value (log-rank, 1-sided) 0.00004 60 50 40 30 20 10 0 10 20 50 0 30 60 40 Time (weeks) Time to Progression - ITT Population % of patients free from progression* 100 70 Geyer et al. NEJM 2006;355:2733-2743
Overall Survival - ITT Population 100 Cumulative Survival % 90 80 70 60 50 Lapatinib + Capecitabine Capecitabine 40 No. of pts 163 161 30 Deaths 36 35 Median OS NR NR 20 Hazard ratio (95% CI) 0.92 (0.58, 1.46) 10 P value (log-rank, 2-sided) 0.72 0 0 10 20 30 40 50 60 70 80 90 Time (weeks) Geyer et al. NEJM 2006;355:2733-2743
Most Frequent Adverse EventsAll Grades 100 90 Severity Gr 4 % of Patients 80 Gr 3 70 Gr 2 L+C 1 C 60 Gr 1 L+C 12 L+C 50 2 C 7 11 2 C 40 20 13 L+C 12 11 1 30 32 26 7 14 C 20 1 27 28 29 5 20 10 13 10 14 9 0 Diarrhea PPE Rash Nausea Geyer et al. NEJM 2006;355:2733-2743 L = lapatinib; C = capecitabine
Phase III HER2+ Adjuvant Trial: ALTTO Surgery and Chemotherapy Completed Randomize Estimated N = 8,400 Lapatinib 1,000 mg daily + 3-wkly Trastuzumab 6 mg/kg (52 wks) Wkly Trastuzumab 2 mg/kg (12 or 18 wks) Lapatinib 1,500 mg daily (52 wks) 3-wkly Trastuzumab 6 mg/kg q3wks (52 wks) Washout (6 wks) Lapatinib 1,500 mg daily (28 or 34 wks) Primary outcome measures: DFS Anti-HER2 therapy can overlap chemotherapy Dose adjustments: Lapatinib reduced to 750 mg daily when given with wkly paclitaxel and trastuzumab, due to high grade 3 toxicities, mainly diarrhea Sep 2011: Independent committee indicated that the lapatinib-alone arm is unlikely to meet the pre-specified criteria to demonstrate non-inferiority to trastuzumab alone with respect to DFS - Lapatinib-only arm halted . .
NCIC MA.31/EGF108919 Women with HER2-positive (central or local lab) MBC and no prior chemotherapy or HER2-targeted therapy in the metastatic setting Primary Outcome: PFS • Taxane: Paclitaxel 80 mg/m2 IV weekly (3 of 4) or Docetaxel 75 mg/m2 IV every 3 weeks • Anti-HER2/neu therapy: • Lapatinib (L) 1250 mg PO daily + taxane; monotherapy 1500 mg PO daily • Trastuzumab (T): Loading dose, then 6 mg/kg IV every 3 weeks or 2 mg/kg IV weekly Gelmon KA et al. ASCO 2012 Annual Meeting. Abstract LBA671
NCIC MA.31/EGF108919 PFS in Centrally Confirmed HER2 Positive 100 Median PFS TTAX/T = 13.7 months LTAX/L = 9.0 months 80 60 HR = 1.48 (95% CI,1.15-1.92); P = 0.003 Percent 40 20 TTAX/T LTAX/L 0 0 20 30 40 15 25 35 5 10 Time (months) No. at Risk TTAX/T 259 181 93 39 20 8 1 0 0 266 178 71 30 10 2 0 0 0 LTAX/L Gelmon KA et al. ASCO 2012 Annual Meeting. Abstract LBA671
Neratinib N O O N CI HN HN CN N EtO 1Rabindran S et al Cancer Res 20042Burstein H et al J Clin Oncol 2010 • Oral tyrosine kinase inhibitor of HER 1, 2, 4 • In vivo data1: • HER2 receptor autophosphorylation • Inhibits cell proliferation & irreversible binding of cysteine residue in ATP-binding pocket • BT474 cells: inhibition of MAPK, Akt phosphorylation, Cyclin D1, p27 induction • Xenografts: rapid (<28 days) dose-dependent & sustained tumor growth regression • Phase 2 trial2 (n=136) trastuzumab-pretreated cohort (66) – naïve (70) • ORR: 24% & 56% respectively • 16-week PFS: 59% & 78% respectively
ExteNETStudy Design Part A Part C Part B • HER2+ breast cancer (local) • Prior adjuvant trastuzumab & chemotherapy • Lymph node –/+ or residual invasive disease after neoadjuvant therapy • ER/PR + or – Neratinib x 1 year 240mg/day 2-year follow-up for iDFS 5 + year survival 5-year follow-up for iDFS 1:1 randomization N=2840 Placebo x 1 year Primary endpoint: invasive disease-free survival (iDFS) Secondary endpoints: DFS-DCIS, time to distant recurrence, distant DFS, CNS metastases, overall survival, safety Other analyses: biomarkers, health outcome assessment (FACT-B, EQ-5d) Stratified by: nodes 0, 1–3 vs 4+, ER/PR status, concurrent vs sequential trastuzumab
Study Evolution • Feb 2010a Sponsor 2 • 1o: aITT iDFS • Sample size: 3300 • aITT population: • Stage 2–3, LN+ • <1 year trastuzumab • April 2009 Sponsor 1 • 1o: Invasive DFS • Sample size: 3850 • Stage 1–3c • <2 years from trastuzumab • October 2011 Sponsors 2 / 3 • Recruitment ceased Nov 2011 • Patients recruited: 2840 • Follow-up truncated at 2 years for all patients • January 2014 Sponsor 3 • 1o endpoint: ITT iDFS (n=2840) • Restored 5yr & OS follow-up • I-SPY 2b: (neoadjuvant study to define agents which meet high Bayesian predictive probabilities of success) • pCR: 39% paclitaxel + neratinib vs. 23% paclitaxel + trastuzumab • 95% probability of superiority vs. standard therapy a December 2009 SABCS NCCTG N9831 & BCIRG006 update b December 2013 aITT = Amended ITT population CRO providing independent statistical analyses to IDMC was consistent from onset CRO managing data collection & monitoring was consistent from onset Sponsor 3 remained blinded to treatment allocation for primary analysis & remains blinded for survival events
Primary Endpoint: Invasive DFS (ITT) 100 90 97.8% 80 93.9% 95.6% 70 91.6% 60 P-value = 0.009 HR (95% CI) = 0.67 (0.50–0.91) 50 Disease-free survival (%) 0 Neratinib Placebo 3 15 0 6 9 12 18 21 24 Months after randomization No. at risk Neratinib Placebo 1420 1420 1260 1324 1229 1292 1189 1243 1108 1163 1033 1090 662 704 1291 1367 1150 1209
iDFS by Hormone Receptor HR-positive (n=1631) HR-negative (n=1209) 97.9% 97.6% 100 100 95.4% 92.0% 96.0% 95.0% 91.2% 92.2% 90 90 80 80 HR=0.51 (95% CI 0.33–0.77) p=0.001 70 70 HR=0.93 (95% CI 0.60–1.43) p=0.735 Disease-free survival (%) Disease-free survival (%) 60 60 0 0 24 24 3 15 3 15 6 9 12 18 21 6 9 12 18 21 50 50 Neratinib Placebo Neratinib Placebo 0 0 Months after randomization Months after randomization No. at risk Neratinib Placebo No. at risk Neratinib Placebo 816 815 721 761 698 741 677 716 629 669 591 622 380 401 737 784 653 699 604 605 539 563 531 551 512 527 479 494 442 468 282 303 554 583 497 510
Pre-specified Sub-populations 98.1% 94.7% iDFS (aITT – higher risk group) iDFS centrally-confirmed HER2+ (ITT) 94.9% 90.6% 97.5% 92.9% 100 100 P-value = 0.002 HR (95% CI) = 0.51 (0.33–0.77) 94.8% Disease-free survival (%) 89.8% 90 90 80 80 P-value = 0.01 HR (95% CI) = 0.66 (0.47–0.92) Neratinib Placebo Disease-free survival (%) 70 70 60 60 No. at risk Neratinib Placebo No. at risk Neratinib Placebo 3 15 3 15 0 6 9 12 18 21 0 6 9 12 18 21 24 24 423 428 859 895 768 785 938 935 842 869 825 846 797 813 737 753 686 696 Months after randomization 374 356 692 706 635 623 741 722 683 684 672 663 654 641 610 599 570 561 50 50 Neratinib Placebo 0 0 Months after randomization
Activates antibody-dependent cellular cytotoxicity Inhibits shedding and, thus, formation of p95 Inhibits HER2-mediated signaling Trastuzumab and Pertuzumab Bind to Distinct Epitopes on HER2 Extracellular Domain Trastuzumab (4D5) Pertuzumab (2C4) • Inhibits dimerization • Potent inhibitor of HER-mediatedsignaling pathways • Activates antibody-dependent cellular cytotoxicity Hubbard SR. Cancer Cell 2005;7:287-288
CLEOPATRASchema Docetaxel + Trastuzumab+ Placebo 1:1 randomization HER2+ MBC N = 800 Docetaxel + Trastuzumab + Pertuzumab An international Phase III randomized, double-blind, placebo-controlled study (approximately 250 sites worldwide) Endpoints: • Progression-free survival • Overall survival • Biomarker analysis Baselga J, et al. NEJM 2012;366:109-119
CLEOPATRAPrimary Endpoint: Independently Assessed PFS 100 Ptz + T + D: median 18.5 months ∆ = 6.1 months 90 Pla + T + D: median 12.4 months 80 70 60 433 PFS events 50 Progression-free survival (%) 40 HR = 0.6295% CI 0.51‒0.75p<0.0001 30 20 10 0 0 5 10 15 20 25 30 35 40 Time (months) n at risk 406 311 209 93 42 17 7 0 0 Ptz + T + D 402 345 267 139 83 32 10 0 0 Pla + T + D Baselga J, et al. NEJM 2012;366:109-119
CLEOPATRA Adverse Events (all grades)≥25% incidence or ≥5% difference between arms Baselga J, et al. NEJM 2012;366:109-119
CLEOPATRA Final OS Analysis Ptz + T + D: median 56.5 months Δ 15.7 months 100 90 Pla + T + D: median 40.8 months 80 70 60 50 OS (%) 40 HR 0.68 95% CI = 0.56, 0.84p = 0.0002 30 20 Chemo alone 10 0 0 10 20 30 40 50 60 70 Time (months) n at risk Ptz + T + D 402 371 318 268 226 104 28 1 Pla + T + D 350 289 230 179 91 23 0 406
CLEOPATRAUpdated PFS 100 Δ 6.3 months Ptz + T + D: median 18.7 months 90 Pla + T + D: median 12.4 months 80 70 60 HR 0.6895% CI = 0.58, 0.80 p < 0.0001 50 PFS (%) 40 30 20 10 0 0 10 20 30 40 50 60 70 80 Time (months) No. at risk Ptz + T + D 402 284 179 121 87 37 6 0 0 Pla + T + D 406 223 110 75 51 21 6 0 0 ITT population. Stratified by geographic region and neo/adjuvant chemotherapy.
Innate and Adaptive Immunity of TrastuzumabDependent on Functional FcγR Adaptive Immunity Innate immunity Bianchini G and Gianni L. Lancet Oncol 2014;15:58-68
NRG BR-004 Approved Concept HER2-Positive, First-line Metastatic Breast Cancer • STRATIFICATION • Prior adjuvant or neoadjuvant trastuzumab (yes; no) • Prior adjuvant or neoadjuvant pertuzumab (yes; no) • Estrogen receptor status (positive; negative) RANDOMIZATION Arm 1 Paclitaxel 2 of 3 weeks + Trastuzumab + Pertuzumab‡ every 3 weeks until progression Arm 2 Paclitaxel 2 of 3 weeks + Trastuzumab + Pertuzumab‡ every 3 weeks until progression + Pembrolizumab 200 mg every 3 weeks until progression or for 1 year Paclitaxel: 80 mg/m2 IV Days 1 and 8 every 3 weeks cycle for at least 6 cycles ‡ Trastuzumab + Pertuzumab: Trastuzumab IV (administer a loading dose of 8 mg/kg; then 6 mg/kg every 3 weeks until progression) + Pertuzumab IV (administer a loading dose of 840 mg IV; then 420 mg IV every 3 weeks until progression).
Trastuzumab-MCC-DM1 • Binds to HER2 with affinity similar to trastuzumab • Provides intracellular delivery of mertansine • Derivative of maytansine, a natural-product microtubule polymerization inhibitor • 20-100 more potent than vincristine
T-DM1: Mechanism of Action HER2 T-DM1 Emtansine release Inhibition of microtubule polymerization P P Lysosome P Internalization Nucleus Adapted from LoRusso PM, et al. Clin Cancer Res 2011
T-DM1 vs. Capecitabine + LapatinibHER2 Positive Metastatic Breast Cancer T-DM1 (3.6 mg/kg) q3w HER2-positiveLocally advanced or metastatic BCPreviously receivedtrastuzumab-based therapy Lapatinib (1250 mg/day) Days 1–21+Capecitabine (2000 mg/m2) Days 1–14 q3w Primary end point: PFS Secondary end points: OS, quality of life Allowed crossover at progression Verma S et al. NEJM. 2012;367:1783-1791
EMILIAPFS by Independent Review 1.0 0.8 0.6 0.4 Proportion progression-free 0.2 0.0 0 2 4 6 8 10 12 14 16 18 20 22 24 26 28 30 Time (mos) No. at risk by independent review: Cap + Lap 496 404 310 176 129 73 53 35 25 14 9 8 5 1 0 0 18 54 T-DM1 495 419 341 236 183 130 101 72 30 9 3 1 0 44 Unstratified HR=0.66 (P<0.0001) Verma S et al. NEJM. 2012;367:1783-1791
EMILIAOS at Second Interim Analysis No. ofEvents Median PFS Months 100 85.2% (95% CI, 82.0-88.5) 25.1 Lapatinib/Capecitabine 182 149 T-DM1 30.9 80 64.7% (95% CI, 59.3-70.2) Stratified hazard ratio - 0.68(95% CI) HR was 0.62 at First Interim NS 78.4% (95% CI, 74.6-82.3) 60 OS (%) 40 51.8% (95% CI, 45.9-57.7) Efficacy stopping boundary, P = 0.0037 or hazard ratio 0.73 20 0 0 2 4 6 8 10 12 14 16 18 20 22 24 26 28 30 32 34 36 Months No. at Risk 13 495 496 471 485 453 474 457 435 439 403 418 368 349 297 240 293 242 204 159 197 164 133 110 136 111 86 63 86 62 45 38 27 17 28 7 5 4 Lap +Cap T-DM1 Verma S et al. NEJM 2012;367:1783-1791
EMILIA Non-Hematologic Adverse EventsGrade ≥3 AEs With Incidence ≥2% Verma S et al. NEJM 2012;367:1783-1791
TH3RESA Study Schema HER2-positive (central) advanced BC (N~600) ≥2 prior HER2-directed therapies for advanced BC Prior treatment with trastuzumab, lapatinib, and a taxane T-DM1 3.6 mg/kg q3w IV (n~400) PD 2 Treatment of physician’s choice (TPC) (n~200) T-DM1 (optional crossover) PD 1 Wildiers H et al. ECCO 2013 Stratification factors: World region, number of prior regimens for advanced BC, presence of visceral disease Co-primary endpoints: PFS by investigator and OS Key secondary endpoints: ORR by investigator and safety
TH3RESAPFS by Investigator Assessment 1.0 0.8 0.6 Proportion progression-free 0.4 0.2 0.0 0 2 4 6 8 10 12 14 Time (months) No. at risk: TPC 198 120 62 28 13 6 1 0 T-DM1 404 334 241 114 66 27 12 0 Median follow-up: TPC, 6.5 months; T-DM1, 7.2 months. Unstratified HR=0.521 (P<0.0001). Wildiers H et al. ECCO 2013
TH3RESAFirst Interim OS Analysis 1.0 Observed 21% of targeted events 0.8 0.6 0.4 Proportion surviving 0.2 0.0 0 2 4 6 8 10 12 14 16 Time (months) No. at risk: TPC 198 169 125 80 51 30 9 3 0 T-DM1 404 381 316 207 127 65 30 7 0 44 patients in the TPC arm received crossover T-DM1 treatment after documented progression. Unstratified HR=0.57 (P=0.004). Wildiers H et al. ECCO 2013
Randomize T-DM1 3.6 mg/kg IV q3wk N = 137 MBC patients (never received chemotherapy or HER2-targeted therapy for locally advanced or metastatic HER2-positive breast cancer) 1:1 Trastuzumab 6 mg/kg IV (8 mg/kg in cycle 1) + Docetaxel 75 or 100 mg/m2 IV q3wk First-Line Treatment With T-DM1 vs Trastuzumab + Docetaxel Phase II until disease progression or unacceptable toxicity, and then followed for survival Hurvitz S et al. European Multidisciplinary Cancer Congress 2011 Abstract 5001
First-Line Treatment of HER2-Positive MBC With T-DM1 vs D + T Hurvitz S et al. European Multidisciplinary Cancer Congress 2011 Abstract 5001
MARIANNE Study Design Trastuzumab + docetaxel (8 mg/kg LD then 6 mg/kg + 100 or 75 mg/m2 q3w) ORTrastuzumab + paclitaxel (4mg/kg LD then 2 mg/kg + 80 mg/m2qw) • HER2-positive (central) LABC or MBC • No prior chemotherapy for LABC/MBC • >6 months from prior (neo)adjuvant vinca alkaloid or taxane chemotherapy T-DM1 + placebo (3.6mg/kg + 840 mg LD then 420 mg q3w) T-DM1 + pertuzumab (3.6mg/kg + 840 mg LD then 420 mg q3w) N = 1095 • Stratification factors: World region, Prior neo-/adjuvant therapy (if Yes: prior trastuzumab/lapatinib), Visceral disease • Primary end point: PFS by independent review facility (IRF), non-inferiority and superiority assessed • Key secondary end points: OS, PFS by investigator, ORR, Safety, Patient-reported outcomes Ellis P, et al. ASCO 2015