Download
1 / 27
290 likes | 622 Views
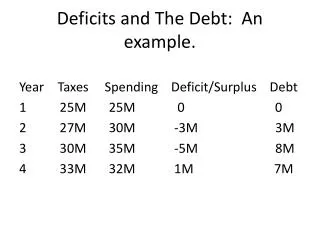
Chapter 19. Government Debt and Deficits. Had been chapters 15 or 16 in earlier editions. No homework!!. Table 19-1, p. 545. Fig. 19-1, p. 549. The Ratio of Government Debt to GDP since 1790. Future Demands on the Federal Deficit . (Different text).

E N D
Chapter 19. Government Debt and Deficits Had been chapters 15 or 16 in earlier editions. No homework!!
Fig. 19-1, p. 549. The Ratio of Government Debt to GDP since 1790.
Future Demands on the Federal Deficit. (Different text) mt believes it is irresponsible to include 80 year projections, because so much can and will change.
Ownership of the U.S. Public Debt, 2005 Other text
US deficits, 1930-2010 Data from U.S. CBO
Review of Deficit/Debt, by Presidents For a long time, balanced budget was the goal. This was changed by Roosevelt, and re-enforced by Kennedy/Johnson The deficit grew dramatically under Reagan. This was caused by his tax cuts, defense spending, and the contractionary policies of the Federal Reserve Bank. A major contributor to the non-re-election of George H Bush was his promise of “No new taxes.” Under Clinton, the deficit was turned into a surplus. Perhaps this was due to good policies. Republicans would claim that it was due to their not letting him spend in areas like Health Care.
P. 382 Bade/Parkin The Bush Plans for a Tax Cut Package ~ 2000 Back to list
Comparison of White House and CBO’s Deficit Projections The major point is the dramatic increase in the deficit in 2009. Source: Washington Post March 21, 2009
What was happening in late 2012 Background to the talks on the “Fiscal Cliff”: a. Tax revenues decline in a recession b. The actual dollar amounts of recent major bail-outs will not be known for a while, until all the accounting is in c. Current debates about the US deficit confuse the current problems from the bailout with the long term structural problems relating to social security and health care. Obama’s victory weakens chances of the proposals pushed by Romney; reduce taxes – especially don’t increase taxes on the rich, the idea that the budget can be significantly altered by filling tax loopholes, further weakening of the social safety net, Social Sec. and Medicare. We will see if they fudge it, as so often happens.
Gramm Rudman Hollings Act, 1985 (and revisions) Set up a multi-year schedule of targets for reduction of gov’t deficits. If the deficit didn’t meet the targets, there would be automatic cuts - ‘sequesters’ - and these automatic cuts would not touch defense nor Social Security. Was declared unconstitutional by the Supreme Court, as it gave somebody (the computer programmer for the Congressional Budget Office) power over both the Legislative and the Executive branches. Also, Congress ignored rules during wars and emergencies. Importance: Seemed to be the last chance at achieving balanced budgets by legislation, short of a constitutional amendment. Rudman to Congress: I’m filing for divorce on the grounds of infidelity and irreconcilable differences.
Fig. 3-9 p. 72. A Reduction in Saving due to Higher Gov’t Spending: Classic Loanable Funds Classic assumes full employment, loanable funds, closed economy,. Complete crowding out – via investments. No change in AD nor prices. (Also, see Ricardian equivalence, below).
Figure 5-3. P. 129. Fiscal Expansion in a Small Open Economy Classic assuming full employment, loanable funds, open economy. Complete crowding out – via net exports. No change in AD nor prices.
Fig. 12-1, p. 329. An Increase in Gov’t Purchases in Closed Economy IS-LM Basic IS-LM, closed economy, not full employment. In short run, incomplete crowding out, and AD moves. With a vertical LRAS, eventually complete crowding out, via investments, with prices rising.
Fig. 13-4, p. 362. Fiscal Expansion Under Floating Exchange Rates: Mundell-Fleming Complete crowding out, via net exports. No assumption of full employment. No change in AD.
Fig. 13.17 p. 393. Fiscal Expansion in a Large Open Economy Incomplete crowding out, reducing investments and net exports. AD moves right: Real GDP increases in short run. (Not covered, F 2013)
Fig. 10-13, p. 295. An Increase in AD New SRAS Rational expectations school claims that an announced increase in Gov’t policy – increasing AD - will lead to an immediate upward shift in SRAS. No change in output, but an increase in prices.
The Laffer Curve. Not even mentioned by Mankiw, buthinted at on page 312?. Made a brief comeback in U.S. politics (mid-2011). Laffer Range Traditional Range (Different Textbook) In the ‘Laffer range’ cutting tax rates will lead to balancing the budget.
Robert Barro, 1944- B.S. in Physics, Cal Tech 1965 Harvard Ph.D. Has taught at Chicago, Brown, MIT Now at Harvard. Link to article on tax reform http://post.economics.harvard.edu/faculty/barro/bw/bw05_01_24.pdf Ricardianequivalence, Economic growth
RicardianEquivalence (19-4, pp. 554-58) The idea that government debt does not influence national saving, nor, therefore capital accumulation, nor AD. No crowding out. Forward looking consumers foresee having to save to pay taxes for the debt, so an increase in government spending today will be offset by a decrease in consumption today. Limited by consumer myopia, borrowing constraints.
Deficits: Actual and forecast New York Times, July, 2004
Deficit under George W. Bush When W. was elected, the projections were for surpluses “as far as the eye can see” As a candidate, W. promised tax cuts, and implemented one quickly after entering office, mailing tax refunds to citizens. The majority of economists would probably agree that the overall impact of W.’s tax cuts has been regressive, i.e. lowering taxes more for the very wealthy.
Projected to decline… but does not include spending on • Iraq, Homeland Security. Comments on Bush’s 2005 Budget 2. Several controversial aspects are future tax cuts, or making permanent future tax cuts 3. Does not incorporate radical supply side predictions, as in Laffer curve 4. Does not confront longer term deficits in social security 5. “Full employment budget” logic would make deficits smaller 6. Sense that many, especially anti-government supply-siders, are willing to “play chicken” – force down tax revenues, and then force down spending.
Presidential Budgets Source: earlier edition of McConnell/Brue Textbook
Surplus/Deficit/GDP, 2000-2050 Projected long term impact of social security.
Why did Clinton’s surplus turn into deficit under W? Analysis according to Henry Aaron (Brookings Inst.) • Economic slowdown (39%) • 9-11 • Bubble economy—Enron, World.com, • Increasing competition from overseas producers 2. Tax cuts (27%) 3. Greater spending on Iraq, Homeland security (19%) 4. Others (15%) Source: http://www.brookings.edu/dybdocroot/views/testi mony/aaron/20040204.pdf