Download
1 / 1
10 likes | 137 Views
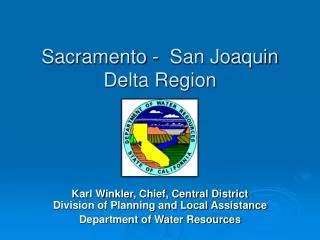
ASSESSMENT OF WARMF MODEL DATA FROM SACRAMENTO AND SAN JOAQUIN WATERSHED. Marcia Scavone-Tansey ( mscavone@water.ca .gov ), Municipal Water Quality Investigations, CDWR. 1. Abstract

E N D
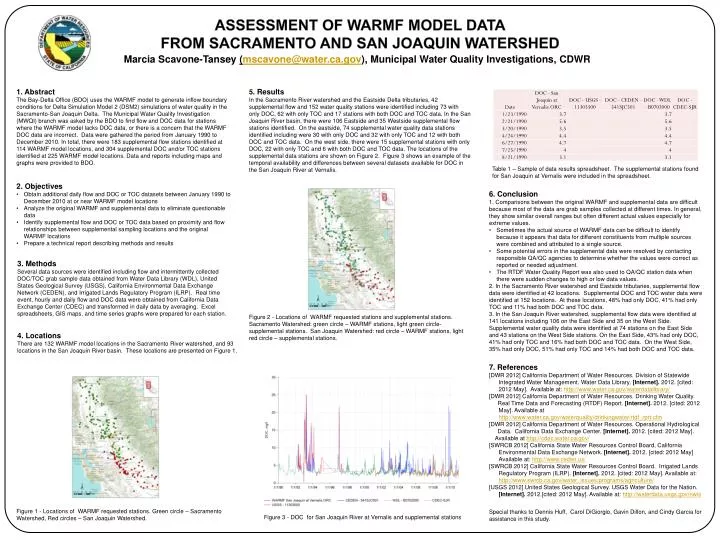
ASSESSMENT OF WARMF MODEL DATA FROM SACRAMENTO AND SAN JOAQUIN WATERSHED Marcia Scavone-Tansey(mscavone@water.ca.gov), Municipal Water Quality Investigations, CDWR • 1. Abstract • The Bay-Delta Office (BDO) uses the WARMF model to generate inflow boundary conditions for Delta Simulation Model 2 (DSM2) simulations of water quality in the Sacramento-San Joaquin Delta. The Municipal Water Quality Investigation (MWQI) branch was asked by the BDO to find flow and DOC data for stations where the WARMF model lacks DOC data, or there is a concern that the WARMF DOC data are incorrect. Data were gathered the period from January 1990 to December 2010. In total, there were 183 supplemental flow stations identified at 114 WARMF model locations, and 304 supplemental DOC and/or TOC stations identified at 225 WARMF model locations. Data and reports including maps and graphs were provided to BDO. • 5. Results • In the Sacramento River watershed and the Eastside Delta tributaries, 42 supplemental flow and 152 water quality stations were identified including 73 with only DOC, 62 with only TOC and 17 stations with both DOC and TOC data. In the San Joaquin River basin, there were 106 Eastside and 35 Westside supplemental flow stations identified. On the eastside, 74 supplemental water quality data stations identified including were 30 with only DOC and 32 with only TOC and 12 with both DOC and TOC data. On the west side, there were 15 supplemental stations with only DOC, 22 with only TOC and 6 with both DOC and TOC data. The locations of the supplemental data stations are shown on Figure 2. Figure 3 shows an example of the temporal availability and differences between several datasets available for DOC in the San Joaquin River at Vernalis. Table 1 – Sample of data results spreadsheet. The supplemental stations found for San Joaquin at Vernaliswere included in the spreadsheet. • 2. Objectives • Obtain additional daily flow and DOC or TOC datasets between January 1990 to December 2010 at or near WARMF model locations • Analyze the original WARMF and supplemental data to eliminate questionable data • Identify supplemental flow and DOC or TOC data based on proximity and flow relationships between supplemental sampling locations and the original WARMF locations • Prepare a technical report describing methods and results • 6. Conclusion • 1. Comparisons between the original WARMF and supplemental data are difficult because most of the data are grab samples collected at different times. In general, they show similar overall ranges but often different actual values especially for extreme values. • Sometimes the actual source of WARMF data can be difficult to identify because it appears that data for different constituents from multiple sources were combined and attributed to a single source. • Some potential errors in the supplemental data were resolved by contacting responsible QA/QC agencies to determine whether the values were correct as reported or needed adjustment. • The RTDF Water Quality Report was also used to QA/QC station data when there were sudden changes to high or low data values. • 2. In the Sacramento River watershed and Eastside tributaries, supplemental flow data were identified at 42 locations. Supplemental DOC and TOC water data were identified at 152 locations. At these locations, 48% had only DOC, 41% had only TOC and 11% had both DOC and TOC data. • 3. In the San Joaquin River watershed, supplemental flow data were identified at 141 locations including 106 on the East Side and 35 on the West Side. Supplemental water quality data were identified at 74 stations on the East Side and 43 stations on the West Side stations. On the East Side, 43% had only DOC, 41% had only TOC and 16% had both DOC and TOC data. On the West Side, 35% had only DOC, 51% had only TOC and 14% had both DOC and TOC data. • 3. Methods • Several data sources were identified including flow and intermittently collected DOC/TOC grab sample data obtained from Water Data Library (WDL), United States Geological Survey (USGS), California Environmental Data Exchange Network (CEDEN), and Irrigated Lands Regulatory Program (ILRP). Real time event, hourly and daily flow and DOC data were obtained from California Data Exchange Center (CDEC) and transformed in daily data by averaging. Excel spreadsheets, GIS maps, and time series graphs were prepared for each station. Figure 2 - Locations of WARMF requested stations and supplemental stations. Sacramento Watershed: green circle – WARMF stations, light green circle-supplemental stations. San Joaquin Watershed: red circle – WARMF stations, light red circle – supplemental stations. • 4. Locations • There are 132 WARMF model locations in the Sacramento River watershed, and 93 locations in the San Joaquin River basin. These locations are presented on Figure 1. 7. References [DWR 2012] California Department of Water Resources. Division of Statewide 222Integrated Water Management. Water Data Library. [Internet]. 2012. [cited: 8882012 May]. Available at: http://www.water.ca.gov/waterdatalibrary/ [DWR 2012] California Department of Water Resources. Drinking Water Quality. cccRealTime Data and Forecasting (RTDF) Report. [Internet]. 2012. [cited: 2012 hhhMay]. Available at hhhhttp://www.water.ca.gov/waterquality/drinkingwater/rtdf_rprt.cfm [DWR 2012] California Department of Water Resources. Operational Hydrological sssData. California Data Exchange Center. [Internet]. 2012. [cited: 2012 May]. rrrAvailableat http://cdec.water.ca.gov/ [SWRCB 2012] California State Water Resources Control Board,California 444Environmental Data Exchange Network. [Internet]. 2012. [cited: 2012 May] 555Available at: http://www.ceden.us/ [SWRCB 2012] California State Water Resources Control Board. Irrigated Lands 322Regulatory Program (ILRP). [Internet]. 2012. [cited: 2012 May]. Available at: 222http://www.swrcb.ca.gov/water_issues/programs/agriculture/ [USGS 2012] United States Geological Survey. USGS Water Data for the Nation. [Internet]. 2012.[cited: 2012 May]. Available at: http://waterdata.usgs.gov/nwis Figure 1 - Locations of WARMF requested stations. Green circle – Sacramento Watershed, Red circles – San Joaquin Watershed. Special thanks to Dennis Huff, Carol DiGiorgio, Gavin Dillon, and Cindy Garcia for assistance in this study. Figure 3 - DOC for San Joaquin River at Vernalis and supplemental stations