Download
1 / 12
120 likes | 231 Views
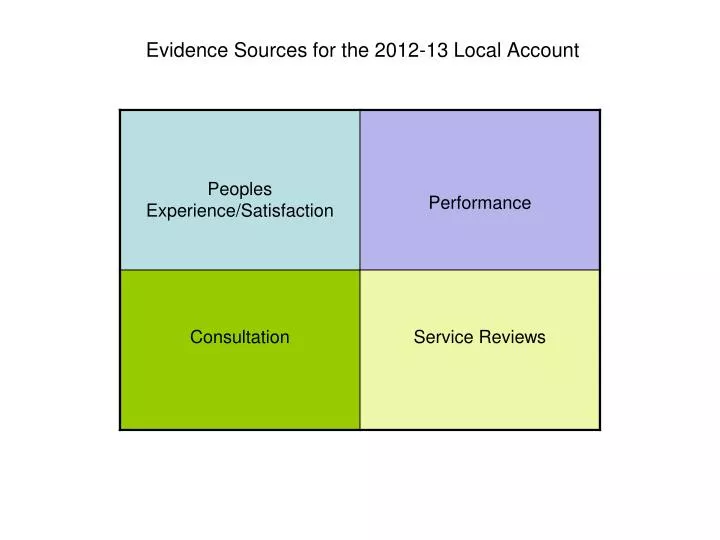
Evidence Sources for the 2012-13 Local Account. PEOPLES ’ EXPERIENCE/SATISFACTION. Survey Data in ASCOF. Feedback Comments from the carers survey

E N D
Feedback Comments from the carers survey • 375 people (39.9%) responded to the survey as opposed to 305(40%) the 9-10 survey. We ensure that the survey includes enough space for people to record any comments they wish to make. 132 people took advantage of the space allowed and their responses can be categorised as a number of key areas:- How we cope 40 Not happy with ASC 24 Not happy with others 18 Areas for improvement 20 Thank you 26 (+13 positive comments about services In the sections above bar ‘not happy with ASC) • The comments categorised under areas for improvement tend centre on three main strands: Issues of poor communication/consultation and bureaucratic process (6): Issues of poor information (6) either lack of or access to: and a lack of responsiveness (8), primarily about timeliness of response; • In terms of ideas the responses primarily pick up on areas where we need to improve what we do. In terms of new ideas there is a suggestion of a social care contact pack to remove the uncertainty about who is involved, doing what and limit duplication (isn’t this the SAP folder!!), provision of a directory of services to aid access to information and access to services( DCID???). Being open about information and client’s having only one central caseworker were also individually noted. • How we cope can be largely categorised with the ones who wrote that they are proudly coping with their difficulties (8), those who re-iterated what they receive (4), the nature and difficulties of providing 24 hour care in the community (13), those who find that things are getting harder, primarily deterioration of the cared for person but also issues about benefit cuts, reduction in services and the 5 people who report that their cared for person is now in residential care as they could no longer cope. • Categorisation for not happy with ASC can be broken down into issues around responsiveness and poor communication (12), poor quality provision of information (3) bureaucratic processes (2), denial of services (2) there is also a perception specifically stated by 2 people (i.e. It appears that the key workers primary role is to keep costs to a minimum and not necessarily providing the best help and support needed.) but a subtext in the comments of 6 others that financial pressures impinge on the delivery of social care.
Local Performance indicators: Examples would include: - • Demographics: By 2030 65+ population will have grown by 33% with people aged over 85 growing by 83% • Prevention services: During 2012 – 13 approximately 20% of people aged 65 and over accessed our preventative services. • Access Services: Community & Hospital access teams handled 11,311 contacts during 12-13, 67% of these were existing clients • Hospital Discharge: 1,508 people received a service from Social Care to leave hospital during 12-13. An average of 29 a week. • Reablement/Intermediate care: Our emergency response team and short term assessment and reablement teams provided 56,279 hours of care during 12-13. • Residential reablement: Tiled House admitted 365 people during the year with an average occupancy of 90% • Care & Support: 5,348 services were provided during the period, 3,494 were through community care and 1,854 residential care. • External Home Care: 1,660 people received this support during 2012-13, a total of 531,855 hours. • Internal Home Care: 435 people received 107,736 hours of care during 12-13. • Palliative Care Team: 326 people used the service during 12-13 with 21,723 hours provided. • Expenditure: 51% of the available 65+ budget in 12-13 was spent on residential care, respite and sheltered/extra care housing.
Complaints: 172 received during 2012-13 relating to ASC, compared to: - 209 in 11-12, 223 in 10-11 and 134 in 09-10. Main areas of complaint during 12-13: • 7 areas account for over 75% of complaints: - • Inadequacy of service 34 (Highest individual category last year) • Blue Badge Process 22 (last year 2nd highest category was home closure) • Staff behaviour 17 (was 7th highest individual category last year) • Poor/inaccurate communication 16 (Not in top seven last year) • Delay in Service 15(4th highest last year) • Funding 14 (Not in top 7 last year) • Service not provided/withdrawn 13(Not a numerical significant category last year)
Consultation Events during 2012-13 Included: Take Control Get Involved 70 (52.2%) were willing to be involved in further activities (Engagement Bank development) Ageing Well In Dudley Survey: Overall, how satisfied or dissatisfied are you with the care and support services you receive(d)? 7 (17.5%) I am/was extremely satisfied 16 (40.0%) I am/was very satisfied 13 (32.5%) I am/was quite satisfied 4 (10.0%) I am/was neither satisfied nor dissatisfied 0 (0.0%) I am/was quite dissatisfied 0 (0.0%) I am/was very dissatisfied 0 (0.0%) I am/was extremely dissatisfied Budget Consultation: • Concern over prioritisation in cuts and investment in market • Concerns about cutting people’s direct payments, which could be a false economy. • perception is that costs are driving personalisation.
Some of the reviews carried out in 2012-13 • Quality of Life Audit in Older People, Physical Disability and Sensory Impairment now taking place; cases selected; interviews scheduled for commencement in 13/14. • Evaluation of the Local Authority build for people with learning disabilities completed. • Beacon Improvement Change Consultants have commenced work around evaluation of the customer journey. • Commissioning a review of the Dementia Gateways through ‘New Opportunities’ to commence 5th November 2012. • Gadget Gateway evaluation • Quality of Life Audit (learning disability review) • First responder pilot review • Falls team review • Age UK quality assurance evaluation of the access team • Transport review