Download
1 / 16
160 likes | 385 Views
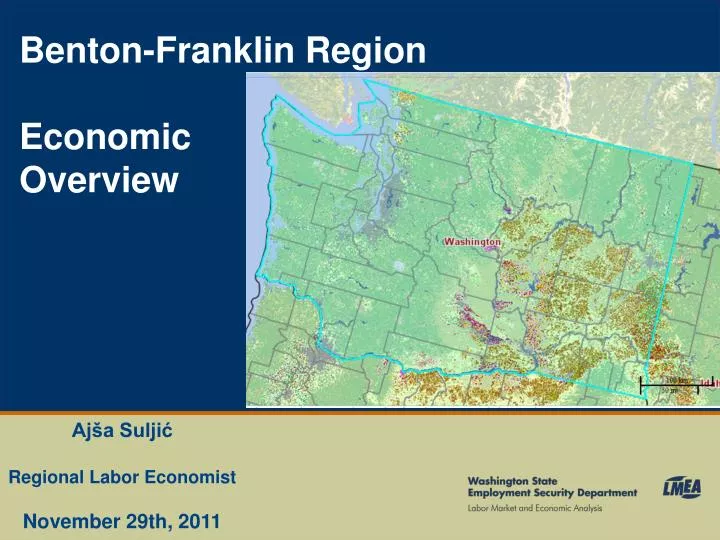
Benton-Franklin Region Economic Overview. Ajša Sulji ć Regional Labor Economist November 29th, 2011. Benton Franklin Region Oct 2010 UI rate 7.8%. Source: Employment Security Department/LMEA; BLS. Review in numbers. Annual Growth Rate est. at 3% since 2006

E N D
Benton-Franklin Region Economic Overview Ajša Suljić Regional Labor Economist November 29th, 2011
Benton Franklin RegionOct 2010 UI rate 7.8% Source: Employment Security Department/LMEA; BLS
Review in numbers • Annual Growth Rate est. at 3% since 2006 • During recession; (12/07-06/09) • B/F= 2.7% and WA=-5.1% • 25 months after recession; (06/08-09/11) • B/F=4.0% and WA=0.1%
Benton-Franklin Region Industry Share Public administration All other industries (private industries not listed individually) Professional, scientific and technical services Administrative support and waste mgmt. and remediation services Retail trade Agriculture, forestry, fishing and hunting Health care and social assistance Accommodation and food services Manufacturing Construction Source: Employment Security Dept/LMEA; QCEW Avg. 2010; BLS
Avg Annual Employment, 2010 108,867 Industry Contributions to Employment Change… Source: Employment Security Dept/LMEA; QCEW Avg. 2010; BLS
Average Annual Wages by Industry 2010 Avg Annual Wage, 2010 $44,996 Source: QWI Online-BLS
Benton-Franklin Region Hanford and Agricultural Clusters • An estimated 30.8% of total employment is in two industry clusters- Hanford and Agriculture. • About 43.3% of total wages are in these two clusters. • Five year annual growth rate of 4.7% (4.0% and 5.4% respectively).
Population Change Benton and Franklin Region POP 2010 253,340 Source: US CENSUS
Poverty RateBenton and Franklin Region KPR MSA MHI $56,407 PV Rate 15.1% Source: US Census
Health Care and Social Assistance Benton and Franklin Region Health Care industry 10.3 % of Total Employment Average Annual Wage $42,461 Average Annual Firms 597 Source: BLS, QCEW- Both Private and Government
Health Care and Social Assistance Benton and Franklin Region Source: BLS, QCEW, both Public and Private
Where are we going… • Population is expected to continue growing for the next 30 years. • Employment in general is expected to grow on average 2.4% a year through 2014 and then slow down to 1.6% growth through 2019 • Industries that will be leading growth • Health Care and Social Assistance • Manufacturing • Educational Services • Professional, Scientific, and Technical
Thank You For Any Questions or Comments About Labor Market Information Contact Ajša Suljić Regional Labor Economist ASuljic@esd.wa.gov 509-734-5928
Check out Washington State Labor Market Information in your areas on the WWW and by contacting your local Economist Labor Market and Economic Analysis