Download
1 / 1
10 likes | 116 Views
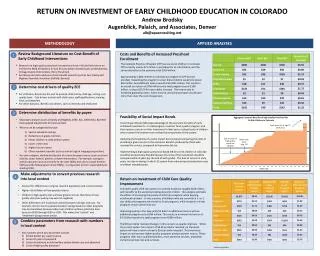
RETURN ON INVESTMENT OF EARLY CHILDHOOD EDUCATION IN COLORADO Andrew Brodsky Augenblick, Palaich, and Associates, Denver alb@apaconsulting.net. Cost of 1 year of high-quality preschool ($6,925). APPLIED ANALYSES. METHODOLOGY. Review Background Literature on Cost-Benefit of

E N D
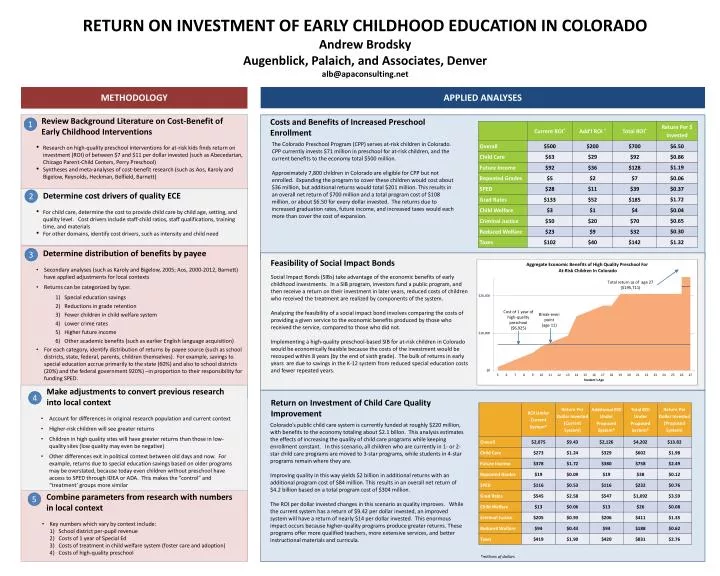
RETURN ON INVESTMENT OF EARLY CHILDHOOD EDUCATION IN COLORADO Andrew Brodsky Augenblick, Palaich, and Associates, Denver alb@apaconsulting.net Cost of 1 year of high-quality preschool ($6,925) APPLIED ANALYSES METHODOLOGY • Review Background Literature on Cost-Benefit of • Early Childhood Interventions • Research on high-quality preschool interventions for at-risk kids finds return on investment (ROI) of between $7 and $11 per dollar invested (such as Abecedarian, Chicago Parent-Child Centers, Perry Preschool) • Syntheses and meta-analyses of cost-benefit research (such as Aos, Karoly and Bigelow, Reynolds, Heckman, Belfield, Barnett) Costs and Benefits of Increased Preschool Enrollment 1 The Colorado Preschool Program (CPP) serves at-risk children in Colorado. CPP currently invests $71 million in preschool for at-risk children, and the current benefits to the economy total $500 million. Approximately 7,800 children in Colorado are eligible for CPP but not enrolled. Expanding the program to cover these children would cost about $36 million, but additional returns would total $201 million. This results in an overall net return of $700 million and a total program cost of $108 million, or about $6.50 for every dollar invested. The returns due to increased graduation rates, future income, and increased taxes would each more than cover the cost of expansion. • Determine cost drivers of quality ECE • For child care, determine the cost to provide child care by child age, setting, and quality level. Cost drivers include staff-child ratios, staff qualifications, training time, and materials • For other domains, identify cost drivers, such as intensity and child need 2 • Determine distribution of benefits by payee • Secondary analyses (such as Karoly and Bigelow, 2005; Aos, 2000-2012, Barnett) have applied adjustments for local contexts • Returns can be categorized by type: • Special education savings • Reductions in grade retention • Fewer children in child welfare system • Lower crime rates • Higher future income • Other academic benefits (such as earlier English language acquisition) • For each category, identify distribution of returns by payee source (such as school districts, state, federal, parents, children themselves). For example, savings to special education accrue primarily to the state (60%) and also to school districts (20%) and the federal government 920%) –in proportion to their responsibility for funding SPED. 3 Feasibility of Social Impact Bonds Social Impact Bonds (SIBs) take advantage of the economic benefits of early childhood investments. In a SIB program, investors fund a public program, and then receive a return on their investment in later years, reduced costs of children who received the treatment are realized by components of the system. Analyzing the feasibility of a social impact bond involves comparing the costs of providing a given service to the economic benefits produced by those who received the service, compared to those who did not. Implementing a high-quality preschool-based SIB for at-risk children in Colorado would be economically feasible because the costs of the investment would be recouped within 8 years (by the end of sixth grade). The bulk of returns in early years are due to savings in the K-12 system from reduced special education costs and fewer repeated years. 3 • Make adjustments to convert previous research into local context • Account for differences in original research population and current context • Higher-risk children will see greater returns • Children in high quality sites will have greater returns than those in low-quality sites (low quality may even be negative) • Other differences exit in political context between old days and now. For example, returns due to special education savings based on older programs may be overstated, because today even children without preschool have access to SPED through IDEA or ADA. This makes the “control” and “treatment’ groups more similar 4 Return on Investment of Child Care Quality Improvement Colorado’s public child care system is currently funded at roughly $220 million, with benefits to the economy totaling about $2.1 billon. This analysis estimates the effects of increasing the quality of child care programs while keeping enrollment constant. In this scenario, all children who are currently in 1- or 2-star child care programs are moved to 3-star programs, while students in 4-star programs remain where they are. Improving quality in this way yields $2 billion in additional returns with an additional program cost of $84 million. This results in an overall net return of $4.2 billion based on a total program cost of $304 million. The ROI per dollar invested changes in this scenario as quality improves. While the current system has a return of $9.42 per dollar invested, an improved system will have a return of nearly $14 per dollar invested. This enormous impact occurs because higher-quality programs produce greater returns. These programs offer more qualified teachers, more extensive services, and better instructional materials and curricula. • Combine parameters from research with numbers in local context • Key numbers which vary by context include: • School district per-pupil revenue • Costs of 1 year of Special Ed • Costs of treatment in child welfare system (foster care and adoption) • Costs of high-quality preschool 5 *millions of dollars