Download
1 / 26
260 likes | 367 Views
Modeling mortality for mixed species stands in coastal British Columbia. Leah Rathbun PhD Candidate, University of British Columbia Tuesday, June 23 rd 2009 Co-advisors: Dr. Valerie LeMay Dr. Nick Smith. Background.

E N D
Modeling mortality for mixed species stands in coastal British Columbia Leah Rathbun PhD Candidate, University of British Columbia Tuesday, June 23rd 2009 Co-advisors: Dr. Valerie LeMay Dr. Nick Smith
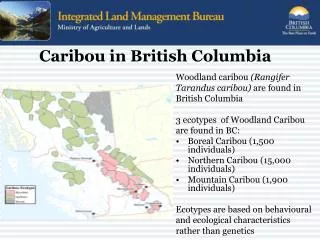
Background • Vancouver Island, the Queen Charlotte Islands and along the coastal mainland • Coastal Western Hemlock (CWH) BEC zone • Multiple subzones: • very dry maritime subzone in the east • moist maritime subzone in the central area • very wet maritime and hypermaritime subzone in the west
Background • Second growth multi-species stands • regenerated both naturally and from plantings
Objectives and Hypotheses • Develop survival models for western hemlock, Douglas-fir, and western redcedar • Hypotheses: 1) A model developed solely for coastal BC would outperform existing models developed for similar species in other areas 2) The inclusion of inter-tree competition variables such as basal area of larger trees, would be highly related to the probability of mortality for trees located in mixed- species stands with structural diversity.
Data • 2,265 untreated plots • 0.008 to 0.806 ha • 1932 to 2002 • 1 to 17 year measurement intervals • 160 to 11,750 stems ha-1 • Site index 6.2 to 52.8 m • Average annual plot mortality 0 to 12% with an average of 1.13%.
Model Development • Logistic survival model • Variety of measurement periods, q • Where f(X) is a linear function of the predictor variables at the beginning of the projection period, X, and q is the number of years within a projection period.
Variable Selection • Tree size and stage of development • Dbh (cm) • Relative Diameter (RDBH) • Height (m) • Site productivity • Site index (m) • Growth Effective Age (GEA) • Inter-tree competition • Curtis’ Relative Density • G (m2/ha) • SPH (stems ha-1) • Basal area of larger trees (BAL, m2/ha) • Crown competition factor of larger trees (CCFL)
Selected Model • Important variables were: • Dbh • Height • BAL • Curtis’ relative density • Site index • Growth effective age • Basal area per hectare
Selected Model • BAL performed the best for western hemlock and western redcedar but not for Douglas-fir • BAL, a competition index, was replaced by relative diameter, a measure of size, for Douglas fir • Inclusion of competition variables within a mortality model is species dependent for mixed-species stands
Model Validation • Temesgen (2002) • Created for cedar-hemlock and Douglas-fir found within interior British Columbia • Hamilton (1986) • Created for mixed conifer stands in Idaho
Model Validation Western Hemlock Large Trees (≥7.5cm) Small Trees (<7.5cm) Sensitivity- % correct for live trees Specitivity- % correct for dead trees
Objectives and Hypotheses • Evaluate three alternative implementation methods. • Hypotheses: 1) Little differences between approaches would be seen when results are aggregated to the stand level. However, differences would become more evident when analyzed within diameter classes 2) Differences would be more apparent for plots with higher mortality rates 3) Of the threshold probabilities, the optimum threshold value would return the best results and should be determined individually for each species within a mixed-species stand
Model Implementation Using the observations at the beginning of the first (establishment) measurement period to predict the probability of survival at the end of the first measurement period using three different methods, two deterministic and one stochastic.
Probability Multiplier • The probability of survival is used to estimate the surviving stems ha-1 at the end of the period SPHq = p(s)* SPH0
Threshold Values • The probability of survival and a specified threshold value are used to estimate the surviving stems ha-1 at the end of the period
Threshold Values • Two subjective threshold values, 0.50 and 0.75 • One optimum threshold value, Cohen’s (1960) optimal threshold, 0.83 Where: po is the proportion of units in which the predicted and actual outcomes agree and pc is the proportion of units for which agreement is expected by chance
Stochastic • For a single trial, the probability of survival and a random number are used to estimate the surviving stems ha-1 at the end of the period The number of trials used was varied as 1, 5, 20, and 1,000 times.
DBH ClassMean Bias values Western hemlock Douglas-fir Western redcedar
DBH Class • Trees less than 7.5cm in dbh • Generally located within the understorey in mixed-species stands • Mortality rates dependent upon differences in shade tolerance • Western hemlock and western redcedar vs. Douglas-fir • The development of separate mortality models may improve predictions for these smaller trees.
Mortality ClassMean Bias values Western hemlock Douglas-fir Western redcedar
Mortality Class • 122 plots, greater than 4% average annual mortality • Average tree size was generally larger, both dbh and height • Larger values for stems per hectare and basal area per hectare • Similar range in Site Index values • On average comprised of 58.9% western hemlock, 27.6% Douglas-fir, and 13.5% western redcedar. • 70.5 % of plots established in the 1950’s and 1960’s • In 1966 through 1968, coastal BC experienced lower than average rainfall for the summer months.
Where do we go from here? • Currently working on the addition of treatment regimes to the mortality models (variations in thinning events, addition of fertilization) • Also currently working on diameter and height increment models
Acknowledgements • Ken Epps and Island Timberland for providing the data for this project • Forest Science Program of British Columbia for funding this project • Dr. Peter Marshall, Dr. Lori Daniels, and Dr. David Hann
I like trees because they seem more resigned to the way they have to live than other things do.- Willa Cather