Download
1 / 22
220 likes | 350 Views
Annual Report on Program Inventory. Board of Trustees Academic & Student Affairs Committee May 20-21, 2014. Overview. Array of programs Annual changes to program inventory Degree credit lengths Approval processes Collaboration P rogram goals and what’s next.

E N D
Annual Report on Program Inventory Board of Trustees Academic & Student Affairs Committee May 20-21, 2014
Overview • Array of programs • Annual changes to program inventory • Degree credit lengths • Approval processes • Collaboration • Program goals and what’s next
Steps for New Program Approval • College and university team members prepare • Notice of Intent • Program application • Notice of Intent published online for statewide comment • Academic Programs staff • Review comments and ensure resolution of any issues • Advise on policy compliance and application completeness • Approve or deny application • Add program to program inventory
Academic Programs 3,744: Number of academic programs 2014 3,917: Average number of programs 2006 to 2014 11%: Program reductions at colleges 2009 to 2014.
Why do programs open, close, change? • We have to inhale and exhale with our academic programs – we need to constantly look at what is viable and what is no longer viable. • [We haven’t had] the ability to grow new programming in tougher economic times. When enrollments are declining and budgets are tightened, there are fewer resources to be innovative and develop new opportunities without grants and external support. • The 60/120 mandate took time away from new program creation. Getting all course outlines loaded into ISRS was also time- and labor-intensive. • Some new programs have been the result of large grants and other incentives. Some programs (green for an example) are closing because they aren’t viable – little to no employment options for graduates. • Working on collaboration/shared programming rather than duplication is shifting some patterns and I would anticipate this will grow.
New Academic Programs 133:Number of new programs, 2014 91: at colleges 42: at universities 93: Average new programs annually, from fiscal year 2006 to 2014
Closed Academic Programs 113:Number of programs closed, 2014 90: at colleges 23: at universities 132: Average closures annually, 2006 to 2014
Programs by Award Level Colleges 2,759 (74%) Universities 985 (26%)
Compliance: Degree Credit Length • Since 2007, legislation requires degree programs to be 60 or 120 credits unless a waiver has been granted. Programs that Exceeded Credit Limits, FY2007 – 2013
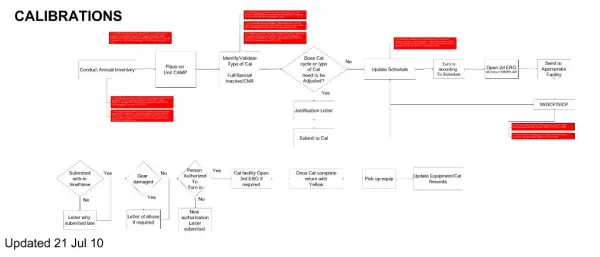
Program Modifications • Colleges, universities and the system office use a common online system called Program Navigator to manage program inventory changes • Colleges and universities have authority to approve changes to program attributes, such as learning outcomes, delivery mode, description, emphases, reinstate a suspended program, etc. • System office approves new programs, closures, suspensions, relocations and changes to key attributes
Publication of the Program Inventory • Students have access to the program inventory through • the MnSCU website (First Search) • MnSCU Viewbook(formerly Go Places & GoMN)
Publication of the Program Inventory • Staff have access to program inventory reports using a custom dashboard in Program Navigator
Current Goal: Quality Outcomes • Learning outcomes stated and measured in all programs: FY13-15 • Colleges and universities tracking and using program-level data for quality assessment
Emerging Goals: Career Development Charting the Future Recommendation 5 • Work together under new models to be the preferred provider of comprehensiveworkplace solutions through programs and services that build employee skills andsolve real-world problems. • New suite of program planning information tools under development for planning • Itasca Workforce Alignment tools being piloted • EMSI, Wanted Analytics • LMIwise • DEED
Emerging Goals: Collaboration Charting the Future Recommendation 2 • A collaborative and coordinated academic planning process that advances affordability, transferability, and access to our programs and services across the state.
Program Collaboration • Health Information Technology • MANE (Minnesota Alliance for Nursing Education) • Early Childhood/Child Development • Centers of Excellence • Professional Science Master’s • Broad field articulation agreements • Engineering • Health sciences