Download
1 / 59
590 likes | 700 Views
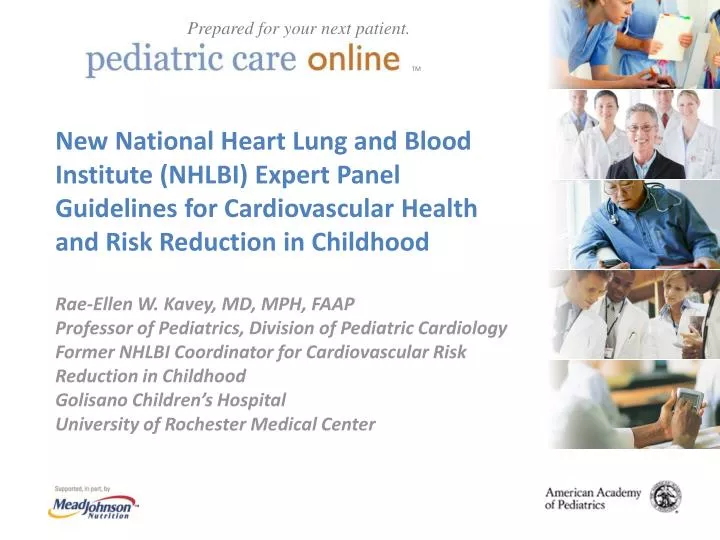
Prepared for your next patient. TM. New National Heart Lung and Blood Institute (NHLBI) Expert Panel Guidelines for Cardiovascular Health and Risk Reduction in Childhood Rae-Ellen W. Kavey, MD, MPH, FAAP Professor of Pediatrics, Division of Pediatric Cardiology

E N D
Prepared for your next patient. TM New National Heart Lung and Blood Institute (NHLBI) Expert Panel Guidelines for Cardiovascular Health and Risk Reduction in Childhood Rae-Ellen W. Kavey, MD, MPH, FAAP Professor of Pediatrics, Division of Pediatric Cardiology Former NHLBI Coordinator for Cardiovascular Risk Reduction in Childhood Golisano Children’s Hospital University of Rochester Medical Center
Disclaimers • Statements and opinions expressed are those of the authors and not necessarily those of the American Academy of Pediatrics. • Mead Johnson sponsors programs such as this to give healthcare professionals access to scientific and educational information provided by experts. The presenter has complete and independent control over the planning and content of the presentation, and is not receiving any compensation from Mead Johnson for this presentation. The presenter’s comments and opinions are not necessarily those of Mead Johnson. In the event that the presentation contains statements about uses of drugs that are not within the drugs' approved indications, Mead Johnson does not promote the use of any drug for indications outside the FDA-approved product label.
Learning Objectives • Understand the complex and diverse evidence base and the review process that led to the 2011 recommendations. • Be aware of the new evidence-based dietary recommendations for cardiovascular health. • Recognize the guideline recommendations for lipid screening and management in childhood. • Be familiar with the format of the guidelines and how to access risk factor (RF)-specific information to use in managing children and adolescents.
Introduction to the guidelines and evidence review process/grading system Overview of the report format: State of the science Individual RF sections—Overview of the evidence and graded recommendations for each major risk factor Age- and RF-specific integrated cardiovascular (CV) health schedule Examples: CV health diet Lipid screening and management Webinar Format
Formal evidence review Graded recommendations by an expert panel. Integrated—multiple RFs addressed in a single guideline Formal United States Department of Health and Human Services (HHS) review and approval process Routinely updated NHLBI Guidelines: New Approach
Endpoint of clinical cardiovascular disease (CVD) remote Wide age range of subjects: Birth to 21 years of age Multiple RFs to be addressed Epidemiologic studies—not just randomized controlled trials (RCTs) = Important evidence Goal: Prevention of risk factors + Prevention of future disease: Primordial and primary prevention Acknowledged gaps in the evidence base but recommendations needed to guide patient care Pediatric Guideline Considerations
(+) family history for CVD Increasing age Male sex Blood pressure (BP)/ hypertension Lipids/dyslipidemia Diabetes mellitus Metabolic syndrome Inflammation Physical inactivity/ sedentary lifestyle Diet/food preferences Obesity Cigarette smoking Risk Factors/Behaviors for CVD
Include rationale for evaluation/intervention in childhood. Include selected observational/epidemiologic studies: National Health and Nutrition Examination Survey (NHANES) Bogalusa Heart Study Muscatine Study Beaver County Lipid Study Pathobiological Determinants of Atherosclerosis in Youth (PDAY) Study Princeton Study Minnesota Children’s Blood Pressure Study Fels Longitudinal Study National Growth and Health Study (NGHS) Cardiovascular Risk in Young Finns Study Time frame: 1981–2008; English language PubMed/MEDLINE/Cochrane Databases Expert panel intrinsic throughout guideline development process, including development of consensus-based recommendations when evidence is insufficient. Modified Evidence Review: Defined Process/Scope
Define critical questions + evidence grading system. Electronic search: >1,000,000 titles serial review 400RCTs/systematic reviews/meta-analyses + 248 epidemiologic studies abstracted into evidence tables Define decision making process for recommendations. Review and grade evidence. Develop age-specific recommendations integrated across RFs and within regular pediatric care. Guideline DevelopmentProcess
Evidence Grading System American Academy of Pediatrics Steering Committee on Quality Improvement. Classifying recommendations for clinical practice guidelines. Pediatrics. 2004;114(3):874–877
Voting to be "in support of" or "opposed to" a recommendation: Agreement by ≥80% Strong consensus, presented as such in the guidelines Agreement by ≤60% Recommendation not included in the guidelines; however, review of the subject could be included in the discussion for that RF area Agreement by 60%–80% Moderate consensus in support of the recommendation; this level of agreement to be presented with that language in the guidelines and accompanied by discussion of the conflicting issues Expert Panel Decision-making Process
Review of the evidence linking RFs in childhood to development and progression of atherosclerosis to manifest clinical CVD: From autopsy and vascular imaging studies: Atherosclerosis begins in childhood. Atherosclerotic extent and progression correlate directly with the number/severity of known RFs. From epidemiologic studies: RFs are present from infancy and track into adult life. Risk behaviors are acquired in childhood and persist into adult life. Low risk entering young adult life is associated with sustained low risk for CVD events. State of the Science Evidence Review
Background: Summary of the epidemiologic evidence linking the RF in childhood to development of CVD Evidence Review Process: All RCTs addressing RF change relative to measured outcomes included and graded with pre-identified criteria. Evidence tables are available athttp://www.nhlbi.nih.gov/guidelines/cvd_ped/index.htm Overview: Due to the large volume/diverse nature of included studies, critical overview is provided in each RF section, highlighting the panel’s view of the most important evidence. Conclusions: Evidence is summarized and graded age-specific recommendations. Where evidence is inadequate, recommendations are a consensus of the expert panel. Individual Risk Factor Sections
Evidence for Controlling Fat Intake in Childhood: Safety and EfficacySTRIP Study: Prospective randomized trial of a low saturated fat, low cholesterol diet beginning in infancy. Abbreviation: STRIP, Special Turku Coronary Risk Factor Intervention Project Simell O, Niinikoski H, Rönnemaa T, et al. STRIP Study Group. Cohort Profile: The STRIP Study (Special Turku Coronary Risk Factor Intervention Project), an Infancy-onset Dietary and Life-style Intervention Trial. Int J Epidemiol. 2009;38(3):650–655
Intervention (INT) group counseled by dietitians to limit saturated fat intake to <10%, total fat to 30%−35% of total calories beginning at 7 months of age Breastfeeding encouraged as long as possible Transitioned from breastfeeding to skim milk Control (CON) group received no special dietary guidance Lipids checked at 8 and 13 months of age, then annually/biannually to 19 years of age Food records/BP/growth at every evaluation Glucose/insulin, bone density at 7 to 8, and 12 and 15 years of age Neuro-cognitive testing at 5, 10, and 15 years of age STRIP Study
STRIP Study: Initial Diet Results * Formula fed infants only
DIET: Significantly lower saturated fat/cholesterol intake from 13 months to 19 years of age. LIPIDS: Significantly lower low-density lipoprotein cholesterol (LDL-C) levels from 13 months to 19 years of age. BP: Systolic blood pressure (SBP) and diastolic blood pressure (DBP) are significantly lower at 15 years of age. OBESITY: Prevalence of obesity is significantly lower in INT girls at 10 years of age (10% vs 18%); no difference in boys. Insulin Resistance: In a random subgroup of 78 INT and 89 CON children at 9 years of age, homeostasis model assessment of insulin resistance index is significantly lower. Metabolic Syndrome (MetS): (MetS = high body mass index [BMI] + ≥2 other RFs); significantly lower prevalence of MetS cluster at 15 years of age, 13% of INT girls/10.8% of INT boys vs 17.5% of CON girls/18.8% of CON boys Vascular Function: Vascular endothelial function is better in boys at 11 years of age. SAFETY: No difference in growth, pubertal change, bone density, or neuro-cognitive function at any time. STRIP Study Results: Intervention vs Control
Dietary counseling begun in infancy is effective with results sustained into young adult life. Lower saturated fat and cholesterol intake from infancy is associated with multiple measures of CV health: sustained lower LDL-C, lower SBP and DBP, less obesity, and less insulin resistance. No adverse effects identified. STRIP Study Conclusions
STRIP Study findings and multiple other RCTs in healthy, normo- and hyper-cholesterolemic children (7 months to 18 years of age) achieved an average total fat intake of 28%−30%, and saturated fat intake of 8%−10% of calories. Lower total cholesterol (TC) and LDL-C levels, lower BP, and less insulin resistance on follow-up No harmful, adverse effects demonstrated on follow-up from 4 months to 19 years of age. Grade A evidence Evidence-based recommendations for routine pediatric care: After 2 years of age, fat free milk is the primary recommended beverage for all children. (Grade A) Low fat milk (fat free 2% [based on judgment of the pediatrician]) can be safely introduced in infants 1 to 2 years of age with weight for height disproportion or with a family history of lipid abnormalities, high BP, morbid obesity, Type 2 diabetes mellitus, or early coronary artery disease (CAD). (Grade B) Evidence Review Summary for Dietary Fat Intake
Among children 2 to 18 years of age in the US, the average daily intake of energy from added sugars is 365 kcal. Sugar-sweetened beverages (soda, energy/sports drinks, fruit drinks) are the top 2 sources of calories from added sugars in all age and demographic groups. Across beverage categories, children 2 to 18 years of age consumed 171 kcal/day from sugar-sweetened beverages (soda and fruit drinks combined). Sugar-Sweetened Beverages: Background
From NHANES 2003–2004, nearly 40% of total calories consumed by 2- to 18-year-olds in the US were empty calories. Half of all empty calories come from 6 specific foods: soda, fruit drinks, dairy, grain desserts, and pizza. In the NGHS, sugar-sweetened beverage consumption was significantly associated with higher daily calorie intake. The average daily calorie intake increased by approximately 82 calories for every 100 grams of soda. A 2006 systematic review of sugar-sweetened beverage intake and weight gain with 21 studies in children and adolescents concluded that greater consumption of sugar-sweetened beverages is significantly associated with both weight gain and obesity. Evidence for Role of Sugar-SweetenedBeverages in Obesity: Epidemiologic Data Striegel-Moore RH, Thompson D, Affenito SG,et al. Correlates of beverage intake in adolescent girls: the National Heart, Lung, and Blood Institute Growth and Health Study.J Pediatr. 2006;148(2):152–154;Malik VS, Schulze MB, Hu FB. Intake of sugar-sweetened beverages and weight gain: a systematic review. Am J Clin Nutr. 2006;84(2):274–288
103 adolescents (BMI >25th percentile) randomized INT: Free home delivery of non-caloric beverages for 25 weeks CON: Usual beverage consumption Results: Consumption of sugar-sweetened beverages decreased by 82% in INT vs no change in CON. Change in BMI: INT: +0.07+0.14; CON: +0.21+0.15 Among BMI top tertile, change was significantly greater for INT(-0.63+0.23 vs +0.12+0.26) Conclusion: Limitation of sugar-sweetened beverage consumption may significantly decrease BMI in obese adolescents. RCT Evidence Regarding Sugar-Sweetened Beverage Intake: 2 Trials Ebbeling CB, Feldman HA, Osganian SK,et al. Effects of decreasing sugar-sweetened beverage consumption on body weight in adolescents: a randomized, controlled pilot study. Pediatrics. 2006;117(3):673–680
6 primary schools in southwest England: 644 children, 7 to 11 years of age Educational program on nutrition focused on carbonated drink consumption for 1 school year. Results: 3-day consumption of carbonated drinks decreased by 0.6 glasses in INT vs an increase of 0.2 glasses in CON. At 12 months of age, the percentage of overweight and obese children decreased by a mean of 0.2% in INT vs an increase of 7.5% in CON. Preventing Childhood Obesity by Reducing Consumption of Carbonated Drinks: Cluster-Randomized Controlled Trial James J, Thomas P, Cavan D, et al. Preventing childhood obesity by reducing consumption of carbonated drinks: cluster randomised controlled trial. BMJ. 2004;328(7450):1237
Epidemiologic Data: Strong evidence that a higher consumption of sugar-sweetened beverages is associated with higher caloric intake and development of obesity. RCTs: In small, select populations, RCTs that limit sugar-sweetened beverage consumption reduce development and/or progression of obesity. Evidence review led to recommendation: Limit naturally sweetened juice consumption to <4 oz/day from a cup in infancy and <6 oz/day in childhood. Recommend no other sugar-sweetened beverage consumption. (Grade B) Evidence-based implications for routine pediatric care: Proactive counseling limiting naturally sweetened juice consumption beginning in early infancy. (Grade B) Clear recommendation advising no consumption of other sugar-sweetened beverages. (Grade B) Conclusions of the Evidence Review on Sugar-Sweetened Beverage Consumption
Cardiovascular Health Integrated Lifestyle Diet (CHILD 1) * Infants who cannot be breastfed should be fed expressed milk. Infants for whom expressed milk is not available should be fed iron-fortified infant formula. **Recommended first step diet, etc.
Cardiovascular Health Integrated Lifestyle Diet (CHILD 1) cont. Supportive Actions: • Milk fat content is to be determined by parents and providers based on growth, appetite, nutrient quality, and risk of obesity/CVD. • 100% fruit juice (from a cup); <4 oz/day • Limit sodium intake. • Consider Dietary Approaches to Stop Hypertension (DASH)-type diet rich in fruits, vegetables, whole grains, low-fat/fat-free milk and milk products; lower in sugar.
Cardiovascular Health Integrated Lifestyle Diet (CHILD 1) cont. Supportive Actions: • Teach portions based on EER. • Encourage moderately increased energy intake during periods of rapid growth and/or regular moderate-to-vigorous physical activity (MVPA). • Encourage dietary fiber from foods: Goal = Age + 5 g/day • Limit naturally sweetened juice to 4 oz/day. • Limit sodium intake. • Encourage healthy eating habits: • Breakfast every day • Eating meals as a family • Limiting fast food meals • Support DASH-style eating plan.
Cardiovascular Health Integrated Lifestyle Diet (CHILD 1) cont. Supportive Actions: • Teach portions based on EER. • Encourage moderately increased energy intake during periods of rapid growth and/or regular MVPA. • Advocate dietary fiber: Goal of 14 g/1,000 kcal. • Limit naturally sweetened juice to 4–6 oz/day. • Limit sodium intake. • Encourage healthy eating habits: • Breakfast every day • Eating meals as a family • Limiting fast food meals • Support DASH-style eating plan.
Estimated Energy Requirements by Age, Gender, and Activity Level
DASH Eating Plan: Servings per Day by Food Group and EER cont.
RISK FACTOR: LIPIDS AND LIPOPROTEINSSCREENING AND MANAGEMENT
Condition is an important health problem. Natural history of the condition is well understood. Detectable RF or disease marker with established norms. Latent period or early asymptomatic stage of disease Acceptable test Benefits of testing exceed risks/harm. Effective treatment exists. Early stage treatment is more effective than later stage. Criteria for Screening Recommendation
Epidemiologic studies provide normative distributions for lipid levels in children and adolescents. (Grade B) Analysis of fasting lipid profile (FLP) identifies 2 major dyslipidemic patterns in childhood (familial hypercholesterolemia, combined dyslipidemia). Dyslipidemia in childhood is directly linked to atherosclerosis at autopsy. (Grade B) In PDAY, 30 mg/dL increment of non-high-density lipoprotein cholesterol (HDL-C) = 2 years of vascular aging. Dyslipidemia in childhood strongly correlates with evidence of atherosclerosis: (Grade B) In the Hopkins medical student study, TC >207 mg/dL at age 21 5x greater risk of CAD 40 years later (vs TC <172 mg/dL) In Muscatine study, elevated TC in youth correlated directly with increased vascular change (carotid intima-media thickness [CIMT]) at 33–42 years of age. Evidence Rationale for Lipid Screening
Selective screening protocols identify less than half of children with extreme hypercholesterolemia. (Grade B) In hypercholesterolemic adults, normalization of LDL-C significantly reduces clinical CV events. (Grade A) Medication for severely hypercholesterolemic children is proven safe and effective in lowering LDL-C in 10 separate RCTs in children for up to 4.5 years. (Grade A) Vascular imaging in children shows decreased atherosclerosis progression with reduction in LDL. (Grade B) Evidence Rationale for Lipid Screeningcont.
No RCT of screening in childhood treatment vs no treatment with follow-up to clinical disease proving that early stage treatment is more effective than treatment at a later stage. Treatment trials in children are relatively short in duration. Evidence Limited/Lacking
Prior guidelines recommend targeted screening based on (+) family history of premature CVD (M <55 years of age; F <65 years of age in expanded 1st degree pedigree) or dyslipidemia, +/- obesity. In multiple studies, 35%–45% of children have been found to have (+) family history and up to 35% will have a BMI >85th percentile. In trials of universal screening, 30%–60% of children/ adolescents with high cholesterol were not identified with targeted screen based on family hx +/- obesity. In addition, family history is not reliable and is often unavailable. Results of Targeted Cholesterol Screening Using Family History and BMI
Non-HDL-C = TC – HDL-C; age-specific norms available Combined measure of all the atherogenic LDL-containing lipoproteins in plasma Accurate in non-fasting state In adults, non-HDL-C = better predictor of CV events than LDL-C In children, non-HDL-C and LDL-C are equally good predictors of adult lipid levels. In epidemiologic studies, non-HDL-C correlated highly with raised lesions in coronary arteries and aorta at autopsy, and with subclinical atherosclerosis on vascular imaging in childhood. Non-HDL-C is an accurate screen for dyslipidemia in childhood. Non-HDL-C = New Screening Measure
Plasma Lipid Distribution (mg/dL) for Children and Adolescents
Age-specific screening recommendations Graded treatment algorithms for diet and drug treatment Evidence-based diet recommendations for children with elevated LDL-C and elevated triglycerides (TG) Drug tables, including age-appropriate dose regimens, side effect profiles, and monitoring schedules Guideline Lipid Management Recommendations
No screening below 2 years of age (Grade C/Recommend) 2−10 years: Selective screening if: Family history (+) for early CVD Parent with known dyslipidemia Child with established RF Child with special risk condition 10 years: Universal screening (Grade B/Strongly recommend) with non-fasting non-HDL-C 11−18 years: Selective screening (as above) 18 years: Universal screening Overview of Lipid Screening Recommendations (Grade B/Strongly recommend)
Evidence-Based Lipid Assessment Recommendations by Age cont.
High Risk: Diabetes mellitus, Type 1 and Type 2 Chronic renal disease/end-stage renal disease/postrenal transplant Post-orthotopic heart transplant Kawasaki disease with current aneurysms Moderate Risk: Kawasaki disease with regressed coronary aneurysms Chronic inflammatory disease (systemic lupus erythematosus, juvenile rheumatoid arthritis) Human immunodeficiency virus infection Nephrotic syndrome Special Risk Conditions
LDL-C >130, <250 mg/dL*→ Target LDL-C TG >100, <500 mg/dL, <10y → Target TG >130, <500 mg/dL, 10−19y (TG algorithm) Dyslipidemia Algorithm: TARGET LDL-C FLP x 2, average results TG >500 mg/dL, → Consult lipid specialist LDL-C >250 mg/dL → Consult lipid specialist Exclude secondary causes. Evaluate for other RFs. Start CHILD 2-LDL diet + lifestyle modification for 6 months. FLP LDL-C <130 mg/dL (=GOAL) → Continue CHILD 2-LDL diet. → Repeat fasting lipid profile q 12m. LDL-C >190 mg/dL → Initiate statin therapy LDL-C>160–189 mg/dL FHx (+) or 1 high-level RF or >2 moderate-level RFs → Initiate statin therapy LDL-C >130–159 mg/dL + 2 high-level RFs or 1 high-level +>2 moderate-level RFs or clinical CVD → Initiate statin therapy LDL-C>130–189 mg/dL FHx (-) No other RFs → Continue CHILD 2-LDL diet. Follow q 6m with lipid profile, FHx/RF update. Follow with FLPs, related chemistries.