Download
1 / 39
390 likes | 583 Views
Healthy imitation. Win-lose strategies can backfire due to imitation Imitation is bad for strategies designed to achieve ‘competitive advantage’, i.e. to do better than others With win-win strategies, imitation is healthy!. Frequent-flyer programs. American Airlines introduced AAdvantage

E N D
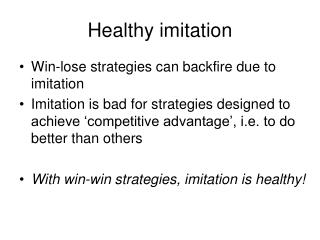
Healthy imitation • Win-lose strategies can backfire due to imitation • Imitation is bad for strategies designed to achieve ‘competitive advantage’, i.e. to do better than others • With win-win strategies, imitation is healthy!
Frequent-flyer programs • American Airlines introduced AAdvantage • This may have attracted some passengers from other airlines • One step forward for American, one step back for United - so far it is win-lose • When United imitated AAdvantage, American lost its ability to gain share • One step forward for United, one step back for American – a net wash
Frequent-flyer programs • But now, with more loyal customers, American wasn’t about to start a price-war • In fact it had room to raise prices • That gave United some room to raise prices • The win-lose competition in terms of share-shifts can give way to win-win element in terms of pricing
Most-favored-customer clause (MFC) • Contractual arrangement that guarantees a customer the best price the seller gives to anyone • Very common in B2B situations • MFCs make it difficult for sellers to give price breaks to anyone • This makes it easier for sellers to maintain high prices • So, why do buyers agree?
Meet-the-competition clause (MCC) • A contractual arrangement that gives a company the option to retain a customer by matching a rival bid • Also called ‘last-look- provision’ or ‘meet-or-release-clause’ • Very common in commodity markets where business stealing is based primarily on price cuts • Has the same competition reducing effects of an MFC
MFC/MCC-like strategies for consumer markets • Guaranteed rebates over a certain future period are sometimes given. Advantages are: -consumers less likely to wait for sales -seller not likely to offer many sales • MFCs don’t work with idiosyncratic products • MCCs don’t work since consumers are not required to give you the option to serve them • Charging a low price to all customers is problematic • Solution: charge a low price to only your own customers but not to your rival’s customers
Overview of CRM / Database mkt • Mass Production, Mass Media and Mass Mkt now replaced by a one-to-one economic system • The one-on-one future represents: - customized products - individually addressable media - individualized delivery channels - personalized pricing • Database mkt is the engine that powers the movement towards effective CRM • The goal is ‘share-of-customer’ rather than market share (also called ‘share-of-wallet’ or ‘share-of-requirements’)
Basic Premise of CRM/ Database Marketing • Retaining an existing customer is better than acquiring a new one • Not all customers are alike • Past behavior is a strong predictor of future behavior • Thus, gathering, maintaining, and analyzing customer and prospect info allows marketers to - identify their ‘better’ and ‘worse’ customers - individually tailor products, prices and promotions to reflect the rankings of various customers - develop relationships satisfying both buyers and sellers
Acquisition vs Retention • Why do companies find it easier to spend on acquisition rather than on retention: - Acquisition is easier to measure - With retention you have to rebut the claim that “they would have come anyway” - Managers find acquisition easier to carry out - Retention involves maintaining an extensive database and analyzing it for patterns • To measure effectiveness of retention, you must have a test and control groups
What is required for Database Marketing? • Relevant data about customers and prospect • Database tech to transform raw data into powerful and accessible mkt info • Statistical techniques to rank customers in terms of their likeliness to - respond to mkt communication - buy products - return products - pay for products - stay or leave
Contact Strategy: What is it? • Contact strategy deals with using information about • Customer purchases • Promotion patterns • Interests, and • Preferences • In order to • Regulate the frequency and sequence of customer contact • Customize the offer, creative thrust, and positioning of contacts
What is new in today’s Contact Strategy • All the key decision criteria are based at the customer or individual level • A customer is included in a promotion or campaign depending on whether there is any incremental profit from contacting the customer
What’s new in today’s Contact strategy • Previously all customers who did not own product A were mailed promotions about product A. • Today, a customer is mailed promotions about product A depending on • How long a person has been a customer? • What products the person has previously bought? • What were the person’s responses to previous mailings, or contacts? • What are the purchase patterns of the person? • These factors are then combined to compute the Return on Investment (ROI) for a particular customer
Customer Lifetime Value • Lifetime value is the NPV of the profit that you will realize on a new customer during a given number of years • Factors in calculation of CLTV - Retention rate - Spending rate - Acquisition cost - Discount rate - NPV calculation - Referral rate
Customer Lifetime Value • Ridgeway Fashions is in fashion retailing • Wants to test idea of a Birthday Club • Women provide their fashion preferences and their husband’s business address. Ridgeway sends husbands a reminder and hints for gifts before wife’s birthday • We will look at Ridgeway before and after the Birthday Club • Look at 20000 customers over a 3 year period
Customer Lifetime Value • Retention rate - The single most important number in the lifetime value table - Is calculated by a simple formula: RR=year X customers/year 1 customers eg RR=8000/20000=40% - Year X customers represent those Year 1 customers who are still buying in the later year
Customer Lifetime Value • Acquisition cost - Add up all money spent on advertising, marketing and sales efforts during the year - Divide this by the number of new customers who actually make purchases from you each year • Discount rate used because profits are received from customers over many years
Customer Lifetime Value • Net Present Value - Once you have the discount rate for each year, each of your profits must be discounted by the corresponding rate - NPV profits=gross profits/discount rate - Add up NPVs of all profits to get cumulative NPV
Customer Lifetime Value • Lifetime value is simply the cumulative NPV profit (CUM-NPV) in each year divided by the original group of customers • CLTV=CUM-NPV/acquired customers 3rd year CLTV in above example is $1201057/20000=$60.05 • Represents the average profit that you can expect to receive, after a given number of years, from the average new customer whom you can sign up
Customer Lifetime Value • Referral rate - Management assumes that the Birthday Club will be successful enough that 5% of it’s customers will recommend Ridgeway to friends/relatives • Usually referred people are more loyal and have higher retention and spending rate than the average new acquisition
RFM: The Workhorse • Key variables to consider for contact strategy: • Recency • Frequency • Monetary Value • Additional help comes from • Promotion History • Demographic Data • Survey data
RFM definitions • Recency • How recently has a customer bought? • Frequency • How frequently does a customer purchase? • Monetary Value • How much does a customer spend on each purchase?
How does RFM work? • Rank Customers according to each variable into say 5 groups. • Give preference to contacting customers who are in the top groups for each variable • Give the most preference to contacting customers who are in the top group for all the variables
How does RFM work? • An RFM chart depicting the groups and the response rates for each group
How does RFM work? • An RFM chart depicting the groups and the response rates for each group
How does RFM work? • An RFM chart depicting the groups and the response rates for each group
Purchase History Information • Time or Tenure of being a customer • Treat new and old customers differently • For new customers send welcome packages • For old customers send offers that recognize their tenure • Offer special privileges to long life customers
Purchase History Information • Total Sales Dollar or Total Sales Dollar over Time • Calculate Revenue Velocity Revenue Velocity (RV) = total amount customer spent total time customer has been purchasing • RV for a customer who has spent $100 in 2 months = 50 • RV for a customer who has spent $100 in 20 months = 5 • First customer preferred over the second
Purchase History Information • Product Ownership • Avoid offending customers by recommending them to buy a product they already have • Very critical for expensive items like cars, insurance, and financial services • Contact customers who do not have a do-not-contact code and are outside the too-soon to contact limit
Purchase History Information • Product Ownership over time • How do you effectively eliminate customers who first sign-up for all offers and then cancel them all within a month? • Look for customers who have owned products/services for a long time and offer only them additional offers
Promotion History • Used to define who is eligible for an upcoming contact • Helpful in creating a market segment • Propensity Indicator • Person’s response rate over time
Promotion History Propensity Indicator (PI) = (# of times bought/ # of times promoted/ time period) • Customer A was promoted 6 times, and bought twice in the last 12 months, PI = (2/6/12)= 0.027 • Customer B was promoted 6 times, and bought twice in the last 18 months, PI = (2/6/18)= 0.018 • Customer C was promoted 4 time, and bought twice in the last 6 months, PI = (2/4/6) = 0.08 • Customer C > Customer A > Customer B
Demographic Information • Create relatively similar customer segments based on demographic and lifestyle characteristics • Characteristics include • Gender, marital status, age, income, home value, presence of children, education level, etc. • Age, marital status, income, presence of children best bets!!!
Attitudinal Information • Survey data used to find • Motivation for purchase • Barriers to purchase • Brand’s impression as compared to a competitor • Brand Equity • Loyalty within a category • Takes a long time to collect • Not very reliable • Use in combination with purchase history and demographic data to profile segments
Combining all Types of Information • Sequentially rank customers based on • First by Purchase History • Second by Demographic Information • Third by attitudinal information • Give preferences to customers who are ranked first in all three categories, then to the ones ranked first in purchase history and so forth
Example: Using RFM for a Promotion • A database marketer with a customer database of 2.1 million names • Wants to do a promotional Rollout • Does a Test promotion first on 30,000 customers • It sent videos costing $100 and it made $40 on each successful sale. Cost of mailing was $0.55 per piece
Example: Using RFM for a Promotion • First all 2.1 mn customers were coded by Recency, Frequency and Monetary Value • Then database was sorted by recency and divided into 5 equal parts (quintiles) which were numbered from 5 (most recent) to 1 (most ancient) • Then each of the 5 recency quintiles was further sorted by Frequency (total no of times a customer purchased from you) and divided in to 5 equal parts • Each recency quintile was thus numbered from 5 (most frequent) to 1 (least frequent) • Then each of the 25 Recency-Frequency combinations was further sorted by Monetary Value and divided into 5 equal parts. Each combo was numbered from 5(most value) to 1(least value)
Example: Using RFM for a Promotion • The Test group of 30000 was selected using an Nth • A Breakeven Index is calculated for each of the 125 cells using the actual responses • Breakeven is the response rate required for the net profit from promotion to a test group to exactly equal cost
Example: Using RFM for a Promotion • The company found that only 34 of the 125 RFM cells broke even • The final promotional offer was mailed to only people in the 34 cells with positive breakeven • Response rate and profits were higher by not promoting to people unlikely to respond