Download
1 / 3
30 likes | 141 Views
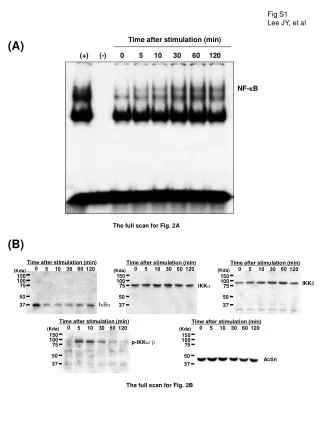
Time after stimulation (min). Time after stimulation (min). 0. 60. 0. 5. 10. 30. 120. 60. 0. 5. 10. 30. 120. 60. 5. 10. 30. 120. (Kda). (Kda). 1 50. 1 50. 1 00. 1 00. I KK . 75. 75. 75. I KK . 5 0. 5 0. 5 0. 37. I B . 37. 37. Time after stimulation (min).

E N D
Time after stimulation (min) Time after stimulation (min) 0 60 0 5 10 30 120 60 0 5 10 30 120 60 5 10 30 120 (Kda) (Kda) 150 150 100 100 IKK 75 75 75 IKK 50 50 50 37 IB 37 37 Time after stimulation (min) Time after stimulation (min) 0 60 0 5 10 30 120 60 5 10 30 120 (Kda) (Kda) 150 150 100 100 p-IKK/ 75 75 50 50 Actin 37 37 The full scan for Fig. 2B Fig S1 Lee JY, et al Time after stimulation (min) (A) (+) (-) 0 5 10 30 60 120 NF-B The full scan for Fig. 2A (B) Time after stimulation (min) (Kda) 150 100
Fig S2 Lee JY, et al (C) Unstimulated control Toxin A + Toxin A alone c-Rel RelB p50 p52 p65 NF-B The full scan for Fig. 2C (A) Time after stimulation (min) Time after stimulation (min) Time after stimulation (min) 0 60 0 5 10 30 120 60 0 5 10 30 120 60 5 10 30 120 (Kda) (Kda) (Kda) 150 150 150 100 100 100 75 75 75 50 50 50 p-ERK ERK p-p38 37 37 37 Time after stimulation (min) Time after stimulation (min) Time after stimulation (min) 0 60 0 5 10 30 120 0 60 60 5 10 30 120 5 10 30 120 (Kda) (Kda) (Kda) 150 150 150 100 100 100 75 75 75 50 50 p-JNK1/2 JNK1/2 50 37 37 p38 37 Time after stimulation (min) 0 60 5 10 30 120 (Kda) 150 100 75 50 Actin 37 The full scan for Fig. 6A
Wild-type NF-B KO Toxin A PD98059 SB203580 SP600125 - - - - + - - - + + - - + - + - + - - + Toxin A BMS - - + - + + - - + - + + 120 (Kda) (Kda) 100 p-IKK/ 75 p-IKK/ 70 45 50 37 30 (Kda) (Kda) 120 100 75 70 50 p-ERK 45 37 Actin 30 The full scan for Fig. 7A (Kda) 100 75 50 p-p38 37 (Kda) 100 75 50 p-JNK 37 (Kda) 100 75 50 Actin 37 The full scan for Fig. 7B Fig S3 Lee JY, et al (A) (B) NF-B KO Wild-type Toxin A BMS - - + - + + - - + - + + NF-B Positive control Negative control Positive control Negative control The full scan for Fig. 7B