Download
1 / 29
290 likes | 404 Views
Monitoring Communication Channels between Targeted Individuals. Ross Sparks. May 2013. Outline. Social networks as a source of information Communications volume between persons of interest Business intelligence Twitter messages – syndromic surveillance-disaster management

E N D
Monitoring Communication Channels between Targeted Individuals Ross Sparks May 2013
Outline • Social networks as a source of information • Communications volume between persons of interest • Business intelligence • Twitter messages – syndromic surveillance-disaster management • Review of spatio-temporal surveillance • Similarities with monitoring communication levels between targeted people • Differences • A suggested solution • Order statistics and qq-plots • Deciding on the appropriate level of network aggregation • Some simulation results • Extensions to higher dimensions Outline| Ross Sparks
Social networks as a source of information • In Australia, twitter messages have been successfully used in the real-time management of bushfires • Who is affected? • How are they affected? • Where is the fire spreading and how fast is it moving? • e.g., a combination of a tornado and a bushfire – very fast - devastating. • Social media information is being mined for security purposes • Facebook is proving useful in criminal investigations • Addresses, photos, activities, etc. • Conversations and networks. • Suspected terrorists and friends are being followed – phone, e-mail and cloud services are all being mined Information| Ross Sparks
Social networks: a source of business intelligence • Companies are monitoring what customers say about them and their competitors. • Companies are monitoring their employees to better manage their risks • What employees say to each other? • What they say to others outside the company? • HR departments of companies are looking at people’s Facebook pages to better evaluate suitability of a person joining the company. • Hence social network monitoring is likely to increase in the future. Business intelligence| Ross Sparks
Ethical issues and privacy concerns • Clearly the privacy concerns are an issue. • Cyber bullying - a concern. • Cyber crime is on the rise • Exploiting children/child pornography • Cyber scams • Misinformation • This paper is not going to deal with the ethical issues relating to social media, but wanted to raise it as an important consideration. Privacy and ethics| Ross Sparks
Setting the scene for monitoring spatial point processes L A T I T U D E LONGITUDE Point Process? | Ross Sparks
The time dimension L A T I T U D E The scan statistic - this counts the number of incidents in the spatio-temporal block and compares it to the expected count TIME LONGITUDE Spatio-temporal surveillance| Ross Sparks
Disease outbreaks which cluster spatially Detecting emerging traffic hot-spots Pockets of Australia where domestic violence is increasing significantly more than forecasts/expected Criminal activity that cluster spatially Identifying geographical regions of higher sales than expected for specific items Identifying geographical regions where there are a higher number of people cessing their household insurance policy than expected etc Applications Spatio-temporal applications| Ross Sparks
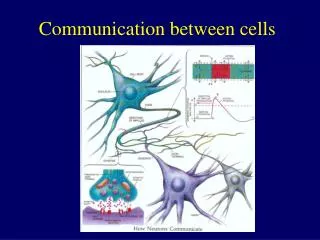
Social networks Social networks| Ross Sparks
Who are “neighbours” in the social network? Number of times A contacts B, etc Social networks| Ross Sparks
Monitoring people who are a security risk • Assume that there are 1000 past criminals (out of jail) that you wish to monitor. • The scan statistic • Looking for gangs of 5 in the above network • This would need to investigate close to 10 billion (using the long scale) potential gangs using an exhaustive “SCAN”. • An computational feasible alternative is needed. Security| Ross Sparks
Dynamic aggregation levels • In the spatio-temporal monitoring we try to dynamically decide on the level and position of spatial aggregation to best detect an outbreak. • In the social network case, the natural neighbours in the network are potential dynamic, • e.g., the neighbours socially may differ to neighbours in terms of criminal gangs. • As such the scan statistic is unlikely to work well in the monitoring of communication levels unless we are lucky and have people in the appropriate order. • Neighbours are not easy to define. Aggregations| Ross Sparks
How to define the best network aggregation? Order Statistics are often useful in defining anomalous cells For each communication cell calculate their signal-to-noise ratio measuring how much their counts depart from expected. Rank these from smallest to largest. Plot these against their theoretical distribution under the assumption that the network communication level has not changed (in-control). Social networks | Ross Sparks
Example Social networks | Ross Sparks
QQ-plot An alternative is p-values and the use a pp-plot of actualsvs theoretical Social networks | Ross Sparks
Is there another way? Sum over all the cell counts that are greater than their expected quantile by grouping all cells with unusually high signal-to-noise ratios as in the previous QQ-plot. Calculate the signal-to-noise ratio for this group. See if it exceeds a threshold Social networks | Social networks
Which cells to aggregate counts? Cells with the highest signal-to-noise ratios Counts=6+5+…+3=24 Expected=2.1+1.7+..+0.4=8 Signal –to-noise ratio for the aggregated group = (24-8)/2.828 Social networks | Social networks
Advantages of this ad hoc procedure No need to order the network into neighbours It works well even in the spatio-temporal setting where “neighbours” are well defined – a paper will soon appear in Communications in Statistics. It works out who to aggregate over and thus determines the number of cells to aggregate. Thus the approach adapts to the size (and shape/network of the outbreak). The approach is very simple – intuitive – easy for non-statisticians to understand. Social networks| Ross Sparks
Some other applications Monitoring several hundred symptoms collected from twitter messages in several countries around the world. Supermarket sales of several hundred or thousands of products at thousands of supermarket stores in Australia. Monitoring various crimes at several hundred key locations. Cancellation of life insurance policies for clients at various geographical locations (sla) by age group. Number of banking transactions – type of transaction by locations in Australia. Number of people travelling between train stations at the peak times of the day in big cities (e.g., Sydney). Social networks| Ross Sparks
Simulated example • We monitor1000 group of target people. • Assumed 100 independent social networks of 10 individuals. • The mean communication daily counts between individuals is taken as uniform on the interval of: • 0.1 to 3 during periods when no crime is being planned, and • 0.0001 for individuals between not in the same gang. • A step change in communications of delta for all individuals within a specific few gangs will be simulated-these are then hidden. • We apply the approach to see how early we detect these “unknown” increases. Simulation| Ross Sparks
Different simulated criminal planning outbreaks • Scenario 1: One cell of ten individuals. • Total communication mean count=137. • Scenario 2: Two neighbouring cells of ten individuals. • Total communication mean count=275 • Scenario 3: Two non-neighbouring cells of ten individuals. • Total mean count=295. • Scenario 4: Three independent cells involving 7 of the 10 within each cell. • Total mean count=204. • Scenario 5: Four independent cells involving 6 of the 10 within each cell. • Total mean count=195. Simulation | Ross Sparks
Fixed number of order statistic Simulations – generating 1000 by 1000 counts matrix. I tried aggregating over the top 25, 50, 75, 100, 150, 200, 250, 300 cells with the highest signal to noise ratio to see which provided the earliest signals of out-of-control events quickly. The in-control Average Run length was taken as 100. Daily counts were generated. The first 500 days were used to estimate in-control cell means. Thereafter hidden out-of-control communication cells were simulated and then the technology was used to find them – recording the run lengths – these were averaged for 100 simulations to give the average run lengths. Order statistics| Ross Sparks
Generation of unusual communication “outbreaks” It is assumed that planning a crime has all participants communication at the same increased level, i.e., not proportional to their social communications. This means that those that don’t communicate much socially but do when planning a crime are going to have bigger communication cell signal-to-noise ratios. The opposite is true if the increase in class is proportionally to their social calls expected counts. Nature of “outbreaks”| Ross Sparks
Scenarios Scenario 1: One cell of ten individuals. (Total communication mean count=136.61). Scenario 2: Two neighbouring cells of ten individuals. (Total communication mean count=275.25). Scenario 3: Two non-neighbouring cells of ten individuals. (Total mean count=294.76). Scenario 4: Three independent cells involving 7 of the 10 within each cell. (Total mean count=204.2). Scenario 5: Four independent cells involving 6 of the 10 within each cell. (Total mean count=194.95). Scenario 6: Four independent cells involving 1 of the 10 within each cell. (Total mean count=194.95). Outbreaks| Ross Sparks
Scenario 1: One cells of ten individuals Scenario 2: Two neighbouring cells of ten individuals each. Results| Ross Sparks
Scenario 3: Two non-neighbouring cells of ten individuals each. Scenario 4: Four independent non-neighbouring cells involving 7 of the 10 people within each cell. Presentation title | Presenter name
Scenario 5: Four independent cells involving 6 of the 10 within each cell. (Total mean count=194.95). Scenario 6: Four non-neighbouring cells of ten individuals Results| Ross Sparks
Conclusions • As long as the increase in calls are at least twice the normal number calls when planning a crime, then it can be flagged within a week. • This is probably sufficient to prevent a gang related crime or a gang related terrorist activity. • Simulations of large scale networks are challenging – needs computing skills better than I currently possess. • The technology can be scaled up to higher dimensions if the simulations process can be improved. Conclude| Ross Sparks
Thank you. Question? CSIRO Computational Informatics Ross SparksResearch scientist t +61 2 9123 4567 e ross.sparks@csiro.au w http://www.csiro.au/ CSIRO Computational INFORMATICS/DIGITAL PRODUCTIVITY FLAGSHIP