Download
1 / 19
200 likes | 377 Views
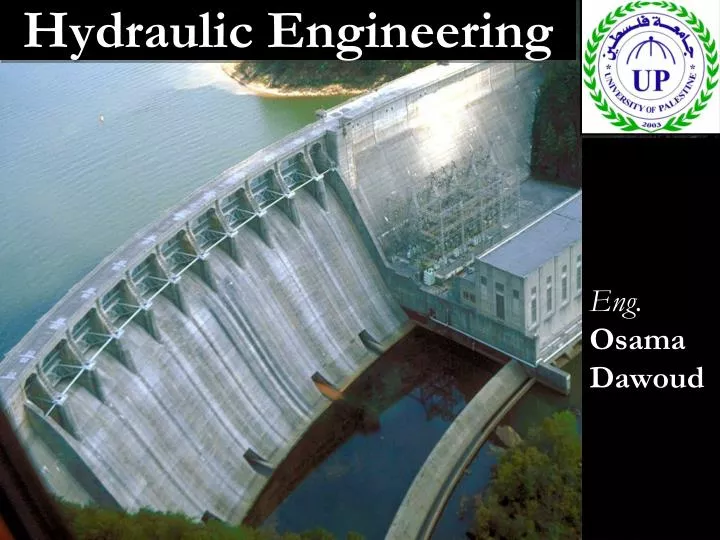
Hydraulic Engineering. Eng. Osama Dawoud. Lecture 13. Water Pump Part 2. Cavitation of Pumps and NPSH.

E N D
Hydraulic Engineering Eng. Osama Dawoud
Lecture 13 Water Pump Part 2
Cavitation of Pumps and NPSH • In general, cavitation occurs when the liquid pressure at a given location is reduced to the vapor pressure of the liquid. For a piping system that includes a pump, cavitation occurs when the absolute pressure at the inlet falls below the vapor pressure of the water. • This phenomenon may occur at the inlet to a pump and on the impeller blades, particularly if the pump is mounted above the level in the suction reservoir.
Cavitation of Pumps and NPSH Successive bubbles breakup with considerable impact force may cause: • high local stresses on the metal surface of the impeller blades and the housing and, hence, causing surface pitting and damaging the pump, • violet vibrations, and • reduction in discharge and noise (vibration).
To avoid cavitation, the pressure head at the inlet should not fall below a certain minimum which is influenced by the further reduction in pressure within the pump impeller. • To accomplish this, we use the difference between the total head at the inlet , and the water vapor pressure head
Where we take the datum through the centerline of the pump impeller inlet (eye). This difference is called the Net Positive Suction Head (NPSH), so that There are two values of NPSH of interest. The first is the required NPSH, denoted (NPSH)R , that must be maintained or exceeded so that cavitation will not occur. The second value for NPSH of concern is the available NPSH, denoted (NPSH)A, which represents the head that actually occurs for the particular piping system.
(NPSH)A applying the energy equation between point (1) and (2) Datum at pump center line
For proper pump operation (no cavitation) it is necessary that: The ratio of (NPSH)R to the total dynamic head, Ht , is defined at the cavitation constant and is known as the Thoma’s cavitation constant ”
Example 1 For the following pump, determine the required pipes diameter to pump 60 L/s and also calculate the needed power. Minor losses 10 v2/2g Pipe length 10 km roughness = 0.15 mm hs = 20 m
To get 60 L/s from the pump hs + hL must be < 35 m Assume the diameter = 300mm Then:
Assume the diameter = 350mm Then: The pump will give a bout 70 L/s
Selection of A Pump It has been seen that the efficiency of a pump depends on the discharge, head, and power requirement of the pump. The approximate ranges of application of each type of pump
System Characteristic Curve • The total head, Ht, that the pump delivers includes the elevation head and the head losses incurred in the system. The friction loss and other minor losses in the pipeline depend on the velocity of the water in the pipe, and hence the total head loss can be related to the discharge rate • For a given pipeline system (including a pump or a group of pumps), a unique system head-capacity (H-Q) curve can be plotted. This curve is usually referred to as a system characteristic curve or simply system curve. It is a graphic representation of the system head and is developed by plotting the total head,
Pump Characteristic Curves Pump manufacturers provide information on the performance of their pumps in the form of curves, commonly called pump characteristic curves (or simply pump curves) The following figures provide the following information: the discharge on the x-axis, the head on the left y-axis, the pump power input on the right y-axis, the pump efficiency as a percentage, the speed of the pump (rpm = revolutions/min), and the NPSH of the pump.