Download
1 / 55
560 likes | 701 Views
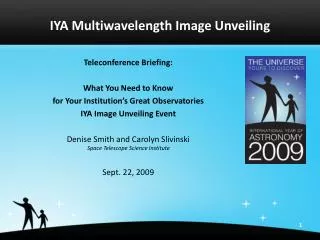
Great Observatories Galactic Center Region Image Unveiling Science Telecon. October 6, 2009. Multiwavelength Observations. Dr. Frank Summers. Support Web Site. http://hubblesource.stsci.edu/events/iyafinale/support/ Generic press release Generic media alert Composite image caption (PDF).

E N D
Great ObservatoriesGalactic Center RegionImage UnveilingScience Telecon October 6, 2009
Multiwavelength Observations Dr. Frank Summers
Support Web Site • http://hubblesource.stsci.edu/events/iyafinale/support/ • Generic press release • Generic media alert • Composite image caption (PDF)
Hubble Space Telescope • Visible, ultraviolet, and infrared observations • 115-2500 nanometers • 2.4 meter mirror • Launched April 1990 • Low Earth orbit • 600 km • 97 minutes • Baltimore, MD
Chandra X-ray Observatory • X-ray observations • 0.17-17 nanometers • 4 cylindrical mirrors • Launched July 1999 • Elliptical orbit • 10-140 thousand km • 64 hr 18 min • Boston, MA
Spitzer Space Telescope • Infrared observations • 3-180 microns • 0.85 meter mirror • Launched August 2003 • May 2009 “warm” mission • Earth-trailing orbit • 0.1 AU per year • Pasadena, CA
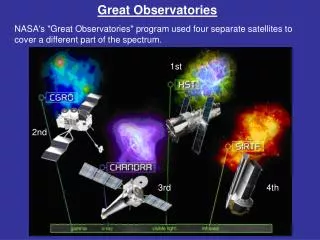
Spitzer Hubble Chandra Compton
Spitzer Space Telescope Dr. Susan Stolovy
The Galactic Center as Seen From the Spitzer Space Telescope/IRAC Dr. Susan Stolovy (PI) Spitzer Science Center/Caltech
Why Observe the Galactic Center with Spitzer? The Galactic Center (GC) is invisible at optical wavelengths (0.4-0.7 microns) from Earth even with the largest telescope imaginable! The interstellar dust in the plane of our Milky Way galaxy absorbs the light from the center, which is 26,000 light years away from us. Spitzer’s mid-infrared cameras see through the dust and can cover large areas efficiently. Artist’s schematic of Milky Way Galaxy (arrow connects the Solar System and the GC) Image courtesy R. Hurt, SSC
The 4 IRAC cameras give us a view extending all the way to the GC: stars (mostly red giants), warm dust, and dark clouds
Spitzer/IRAC Galactic Center (GC) survey details • Field of View covered: 890 x 640 light years assuming the distance to the GC is 26,000 light years • Area in sky covered is 1.9 x 1.4 degrees (roughly equivalent to area 14 full moons would cover) • Observed with 4 mid-infrared cameras from Infrared Array Camera (IRAC) at 3.6, 4.5, 5.8, and 8.0 microns • 3.6 and 4.5 microns show mostly stars and 5.8 and 8.0 show both stars and warm, glowing dust. The glowing dust emission seen in the IRAC images is mostly from tiny, soot-like particles called polycyclic aromatic hydrocarbons (PAH’s). These particles exist on Earth as pollution! • IRAC survey took only 16 hours of telescope time to complete
8 Micron image close-ups showing examples of regions where massive stars have recently formed 1 2 3 4 4 million solar mass black hole hiding here Quintuplet cluster
Radio emission is bright at Sgr A* (black hole), supernova remnants, star forming regions, and mysterious linear filaments near strong magnetic fields
Some Spitzer/IRAC Galactic Center Results • Largest, most sensitive, highest resolution (1-2’’) map of the GC at mid-infrared wavelengths • We see spectacular, complex structure in glowing dust emission, from compact globules to long, stringy filaments • Over one million stars detected in the survey, but region is so crowded that there are many more that we can’t detect • Dark, obscuring clouds seen at many scales • Star-forming regions imaged at GC distance and in spiral arms along the line of sight • Follow-up spectroscopy from Spitzer/IRS has led to discovery of young stellar objects (baby stars) in the GC (An et al. 2009, submitted to ApJL)
3.6 microns=blue, 4.5 microns=green, 5.8 microns=orange and 8.0 microns=red Spitzer’s view of the Galactic Center
Hubble Space Telescope Dr. Susan Stolovy
The Galactic Center as Seen from the Hubble Space Telescope/NICMOS Dr. Susan Stolovy Spitzer Science Center/Caltech PI: D. Wang, UMASS
The HST survey of ionized hydrogen gas (Paschen alpha) in Galactic Center (GC) was observed using the near-infrared camera on Hubble called NICMOS (Near-Infrared Camera and Multi-Object Spectrometer) Although there is still much absorption of light at a wavelength of 1.9 microns from the GC by interstellar dust, enough light gets through in deep exposures to make a large-scale map of the ionized gas possible to make. This is the sharpest image ever of such a large region in the GC; it reveals much about how massive stars form, evolve, and interact with their environment
HST/NICMOS GC survey details • Field of view covered: 270 x 90 light years assuming the distance to the Galactic Center is 26,000 light years • Area in sky covered is 0.6 x 0.2 degrees, roughly equivalent to area of covered by 1/2 full moon; (it’s cropped to a smaller area in press image, however, about 0.4 degrees across in panel “b”) • The Paschen series of hydrogen spectral lines in the infrared is named after the German physicist Louis Paschen, who discovered them in 1908 (the alpha line, at 1.87 microns, is the strongest of the series). The Earth’s atmosphere absorbs this line from celestial sources, so we need a telescope in space to observe it. • NICMOS observations made in 2 narrow-band filters with wavelengths of 1.87 microns and 1.90 microns. Paschen alpha emission arises from ionized hydrogen gas that excited by hot stars. • Took 144 orbits of telescope time to complete: this is the largest area ever covered by NICMOS by a single program. The data have 10 times better resolution (sharpness) than the Spitzer/IRAC data.
Making Paschen Alpha images a) F187N filter b) continuum (F190N) subtracted c) stars removed HST figures from Wang et al., submitted Sept. 2009, MNRAS
1.87 micron image: we detect 600,000 stars!Note also the dark foreground dust clouds Paschen alpha image This shows ionized hydrogen emission near sites of massive stars
a) The central few light years b) the “Pistol”,”Quintuplet” and “Sickle”, c) The Arched filaments: linear features trace local magnetic field “fingers” sculpted by winds from hot stars in Quintuplet cluster Location of black hole (radio source known as Sgr A*)
Close-ups of Selected Nebulae from Pa alpha mosaic of Galactic CenterSeveral of these are newly discoveredHorizontal bar in each figure shows 0.2 parsecs=0.65 light years
Some results from the HST data • Sharpest view ever of the Galactic Center in a large-scale map; shows clear signs of interaction of massive stars with environment: “fingers”, bubbles, outflows, etc. • Amazing network of long, straight filaments seen in great detail for first time in ionized gas; some of them follow magnetic field lines; • New compact nebulae discovered with young massive stars, ranging from early to late stages of star formation • Many candidate massive stars identified by bright Pa alpha emission. Some are located OUTSIDE the 3 known clusters in the GC; they may have been thrown out of parent clusters or formed outside clusters • Spectroscopic follow-up shows that many are exotic stars with strong winds. They will explode as supernovae in the future and will have a large impact on future star formation processes in the GC.
Chandra X-ray Observatory Dr. Peter Edmonds
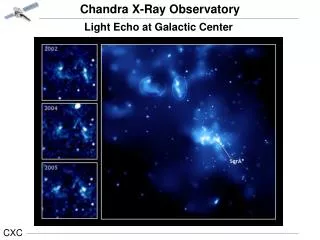
An X-ray view of the Galactic Center Chandra image What do the colors mean in this image? • red: lowest energy X-rays • green: medium energy X-rays • blue: highest energy X-rays
OVERVIEW Chandra image is a mixture of: - hot gas, e.g. remnants of supernovas - point sources of different types - star clusters SOME DETAILS - Sagittarius A: contains the center of the galaxy and a supermassive black hole - Arches and Quintuplet are star clusters - 1E 1743.1-2843 is a double star
Sagittarius A* • - The nearest supermassive black hole to us • - Weighs about 4 million times the Sun • - Area close to it is currently surprisingly dim • - This area was much brighter in the past