Download
1 / 6
60 likes | 141 Views
C++ / G4MICE Course. MICE Data Make Another Application Measure Pions and Protons in the MICE Beam!. Session 9. MICE Data. Un tar the file mice_data.tgz: tar xvzf mice_data.tgz It contains 6 files: 157, 158, 159, 160, 162 & 163

E N D
C++ / G4MICE Course MICE Data Make Another Application Measure Pions and Protons in the MICE Beam! Session 9
MICE Data • Un tar the file mice_data.tgz: • tar xvzf mice_data.tgz • It contains 6 files: • 157, 158, 159, 160, 162 & 163 • These are six runs recorded with the MICE DAQ in which GVA1 and GVA2 were read out. • I have also provided a sample app.in file and Gva2Gva1App.cc file.
GVA1/2 Counters • GVA1 and GVA2 were readout by one channel each in a TDC. • You can find out which from the log book: • https://micelog.dl.ac.uk/MICE+Log/97
Gva2Gva1App.cc • Read through the code and understand what it is doing so far. • At the moment it finds a TDC hit on one channel and fills a histogram with the TDC value. • You need to modify this to find the TDC hits on GVA1 and GVA2 and histogram the individual TDC distributions AND the distribution of the TDC values on GVA2-GVA1 (bin this last one from 0-100).
Compile and Run • Run AppMake on the provided app.in file. • ./Gva2Gva1App 157 158 159 160 162 163 >& log • It is a good idea to redirect the output into the log file as shown above as there is a lot of debug output from the DATE unpacking code at the moment.
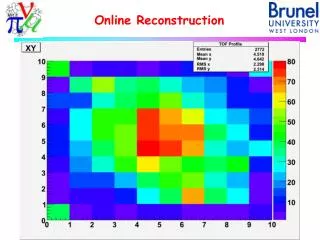
Pions and Protons • This task is complete when you can show a histogram of the difference between the TDC counts in GVA2 and GVA1 which shows a proton and pion peak. • For extra credit – fit the distribution with two gaussians, either in your application or using ROOT interactively.