Download
1 / 27
270 likes | 371 Views
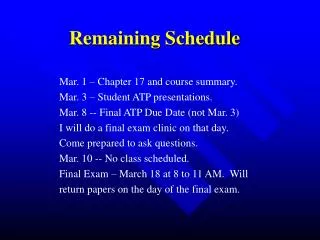
Today’s Schedule T H U R S D A Y MARCH 3rd: . BEGINNING OF CLASS: 10.3 Summary--Books OPEN to problem pg. 588 #57 (15 min) The T-distribution (15min) -Calculator fun! Confidence Intervals and the One Sample T-Test (20 min) Homework Discussion (25 min) Assessment Opportunity (10 min)

E N D
Today’s Schedule THURSDAY MARCH 3rd: BEGINNING OF CLASS: 10.3 Summary--Books OPEN to problem pg. 588 #57 (15 min) The T-distribution (15min)-Calculator fun! Confidence Intervals and the One Sample T-Test (20 min) Homework Discussion (25 min) Assessment Opportunity (10 min) ***if time permits..Matched Pairs T-Test Video (10 min) HW: Read 11.2, Do 20, 38, 40
10.3 Overview Let’s look at #57 Statistical significance is often used to persuade people into buying products, believe a certain claim, cause controversy, instigate discussion... Be careful of what you read...Statistical Significance is not the same as Practical Significance! Badly designed experiments often produce invalid results. Always ask how data were produced!
-The Telegraph -local news site -Scientific American
Beer = yeast + fermented barley How Beer Influenced Statistics Dilemma: How to estimate the average colonies of yeast? We don’t know the population standard deviation! William Gosset 1876-1937
THE t-Distribution! Important Notes, Vocabulary, and math symbols! When we don’t know , we use the sample standard deviation „s” to estimate it. This is the standard deviation of the sample mean KEY POINT: There is a diferent t-distribution for each sample size! We characterize a t-distribution by its degrees of freedom, which is calculated by n-1. This is the standard error of the sample mean.
The t Distribution We use the t-distribution when we don’t know the population standard devation. The curve changes as degrees of freedom (n-1) changes. What happens to the t Distribution as sample size increases? What do you notice about the shape of the t-distribution as compared to the z-distribution?
Turn to page 620 in your book, HW problem 2 Confidence Intervals! Now let’s look at Problem 7!
Spot the differences between these two pictures! CI formula for a population mean when we don’t know CI formula for a population mean when we know one sample z statistic one sample t statistic
Let’s practice creating a Confidence Interval with the t-distribution! Turn to page 628 and check HW problem 10c with your neighbors Now Let’s practice calculating the one sample t statistic! Turn to page 633
What have we learned today... -USE the t-distribution when you dont know sigma! -The t-distribution changes with sample size..but as you increase df, it approaches the normal approximation! -How to find t* and use Table C -What degrees of freedom are -What standard error is and how to find it -How to create a CI when we don’t know population standard deviation -How to calculate the one sample t statistic
Assessment Opportunity Take 10 min individually to see how well you understood the material from today’s class on t distributions. Do this on a blank sheet of paper to turn into me. • What is t* for a 90% confidence interval if degrees of freedom = 10? • As the degrees of freedom increase, the t distribution approaches the ___________ distribution. • The weights of 9 men have mean x-bar = 175 pounds and standard deviation s = 15 pounds. The population average is 170 pounds. What is the standard error of the mean? • What is the one sample t statistic for the data in problem 3? • What two upper tail probabilities does this t-statistic fall between?
Let’s create a 95% confidence interval for the mean difference in perceived professionalism rating for these two pictures Matched Pairs Design http://abcnews.go.com/GMA/video?id=5563289
Today’s Schedule MONDAY MARCH 7th: Finishing 11.1 (Using the t-procedures, robustness, matched pairs) Practice Start 11.2 Assessment Opportunity HW: Re-Read 11.1 and 11.2: Do 42, 50, 53, 55
T procedures are strongly influenced by OUTLIERS ALWAYS make a plot to check for skewness and outliers before you use the t procedures for small samples. Look at page 636
Matched Pairs Design Examples: scores on SAT math before and after taking a Kaplan course (before and after comparison studies) Testing effects of a new drug by pairing subjects up with similar characteristics to eliminate individual differences and giving one of the members placebo and one the new drug
Assessment Opportunity Take 10 min individually to see how well you understood the material from today’s class
Suppose our sample size was 8. When would it be ok to use the t-procedures? 2) Scientists want to study the effects of a new drug that is designed to reduce cholesterol levels in patients. They take one sample of people and put people with similar levels in groups of two, giving one person the drug and one person a placebo pill. Then they analyze the differences between the choclesterol levels within the groups of two. Is this an example of a matched pairs design or independent samples? 3) You want to compute a 90% confidence interval for the mean of a population with unknown population standard deviation. The sample size is 30. The value of t* you would use for this interval 4) I want to test if a diet pill is helping people lose weight. I took a sample of 20 people. My null hypothesis is that the mean weight loss is zero. My alternative hypothesis is that the mean weight loss is greater than zero. My t-statistic is 2.1. Between what two probabilities does my P-value fall? 5) Is my result in problem #4 statistically significant at the 5% level? 1% level?
Today’s ScheduleWEDNESDAY MARCH 9th: Pass Back AOs 11.2 11.1/11.2 Practice HW: Study for your Ch 11 Quiz next class! Finish CH. 11 Toolkits and read 12.1
11.2 Comparing two means (2 sample problems) So far we have learned one sample z procedures and one sample t procedures. We also learned we can used a matched pairs design which compare two treatments by making use of one sample procedures. Conditions for Comparing 2 means: -2 independent SRSs from two populations -both populations are normally distributed Lets look at problem 38 on page 649
1 sample t test statistic 1 sample z test statistic 2 sample t test statistic 2 sample z test statistic
Remember Use t procedures if you don’t know the population standard deviation! If using a two sample t procedure, always use the degrees of freedom associated with the smaller of the two samples. Example: If you took two independent samples, one of size 10 and one of size 9...use degrees of freedom 8 when using table B (C) to find probabilities or t* values.
With the two sample significance test procedures, our null and alternative hypotheses would look like this: Or, equivalently
Confidence interval: statistic ± (critical value) • (standard deviation of statistic)
Let’s look at HW problem #40 on page 657 How badly does logging damage tropical rain forests?