Download
1 / 9
90 likes | 215 Views
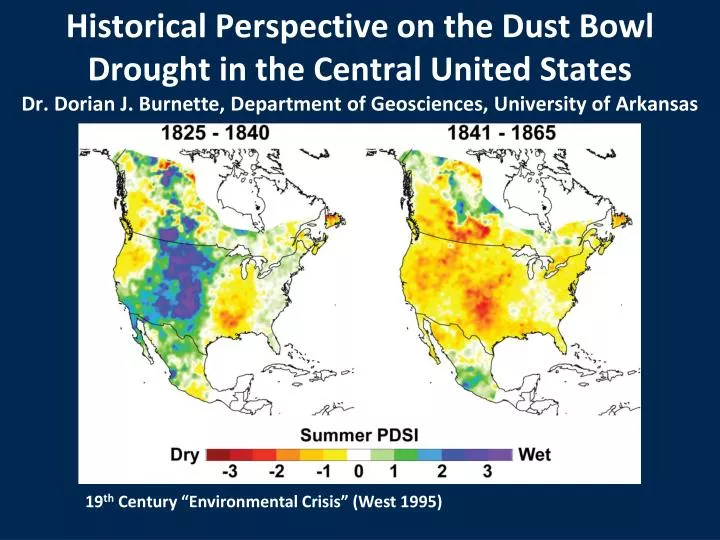
Historical Perspective on the Dust Bowl Drought in the Central United States Dr. Dorian J. Burnette, Department of Geosciences, University of Arkansas. 19 th Century “Environmental Crisis” (West 1995). Precipitation Stations. Five primary stations augmented with surrounding station data

E N D
Historical Perspective on the Dust Bowl Drought in the Central United StatesDr. Dorian J. Burnette, Department of Geosciences, University of Arkansas 19th Century “Environmental Crisis” (West 1995)
Precipitation Stations • Five primary stations augmented with surrounding station data • Reconstruct back to 1850 when at least two station clusters were available
Assessing Precipitation Data Quality • Ideal = negative exponential curve (Daly et al. 2007) • Truncation of light amounts = undercount • Spikes = “5/10 bias” • Threshold analysis = undercount minimized for totals ≥ 0.50 inches
Raw vs. Adjusted Precipitation Totals • Undercount bias appears prior to 1925, so data from 1850-1924 were adjusted • Adjustment = • Use precipitation totals ≥ 0.50 inches (“Half-Inch Threshold”) • Estimate the missing amount between below 0.50 inches based on an average of the modern observations at each station • Add estimate to the “Half-Inch Threshold”
Reconstructed Precipitation Totals for Kansas/Missouri Spring Totals 1860-64 = 246.28 mm 1910-14 = 256.84 mm 1933-37 = 272.14 mm 1952-56 = 260.81 mm Rank 1 2 4 3 Summer Totals 1860-64 = 158.85 mm 1910-14 = 156.72 mm 1933-37 = 135.99 mm 1952-56 = 163.42 mm Rank 3 2 1 4 Growing Season Totals 1860-64 = 405.13 mm 1910-14 = 413.56 mm 1933-37 = 408.13 mm 1952-56 = 424.23 mm Rank 1 3 2 4
Growing Season Temperatures Burnette et al. (2010), Journal of Climate • Potential evapotranspiration computed from reconstructed temperature data using Thornthwaite’s method • Effective Moisture Estimate = precipitation – potential evapotranspiration • Effective Moisture transformed into anomalies by subtracting the seasonal median
Effective Moisture Reconstruction Spring Anomaly 1860-64 = -90.87 mm 1910-14 = -78.49 mm 1933-37 = -69.36 mm 1952-56 = -77.08 mm Rank 1 2 4 3 Summer Anomaly 1860-64 = -51.00 mm 1910-14 = -48.94 mm 1933-37 = -112.47 mm 1952-56 = -52.68 mm Rank 3 4 1 2 Growing Season Anomaly 1860-64 = -141.87 mm 1910-14 = -127.43 mm 1933-37 = -181.83 mm 1952-56 = -129.76 mm Rank 2 4 1 3
Tree-Ring PDSI 1860s vs. 1930s • Study area on the edge of the two intense droughts • Both droughts similar in magnitude but differ in coverage area
Thank You • Acknowledgements: • NSF Doctoral Dissertation Research Improvement Grant • Dissertation Committee: • Dr. David Stahle • Dr. Malcolm Cleaveland • Dr. Cary Mock • Dr. Elliott West • Dr. Ed Cook • E-Mail: • djburne@uark.edu Dust Storm over Midland, TX, 20 February 1894 From Library of Congress • Website: • www.djburnette.com/research/kansas/