Download
1 / 42
420 likes | 530 Views
Society for Research on Educational Effectiveness December 11, 2006. Reducing Risk and Enhancing Protection to Remove Barriers to Learning Richard F. Catalano, Director Social Development Research Group University of Washington www.sdrg.org. Leading Predictors of School Dropout. Poverty

E N D
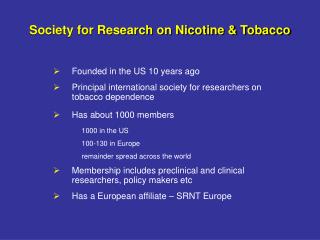
Society for Research on Educational EffectivenessDecember 11, 2006 Reducing Risk and Enhancing Protection to Remove Barriers to Learning Richard F. Catalano, Director Social Development Research Group University of Washington www.sdrg.org
Leading Predictors of School Dropout • Poverty • Delinquency and Drug Abuse • Academic Competence Battin et al., 2000; Newcomb et al., 2002.
Academic Competence, Delinquency, and Drug Abuse • Are the strongest predictors of dropout • Are modifiable • Share common predictors
Advances in Prediction • Longitudinal studies have identified predictors of positive outcomes like success in school • As well as the predictors of substance abuse, delinquency and other problem behaviors
X Family X X X School X X Individual/Peer X X X
Protective Factors Individual Characteristics • High Intelligence • Resilient Temperament • Competencies and Skills (Cognitive, Social and Emotional) In each social domain (family, school, peer group and neighborhood) • Prosocial Opportunities • Recognition for Prosocial Involvement • Bonding (Attachment and Commitment) • Healthy Beliefs and Clear Standards * * * * *
Risk Increases and Protection Decreases Prevalence of 30 Day Alcohol Use
Risk Increases and Protection Decreases Prevalence of 30 Day Marijuana Use
Risk Increases and Protection Decreases Prevalence of “Attacked to Hurt”
Risk Decreases and Protection Increases Prevalence of Academic Success (B or better average)
Number of School Building Risk Factors and Probability of Meeting WASL Standard (10th Grade Students) Arthur et al., 2006
Number of School Building Protective Factors and Probability of Meeting WASL Standard (10th grade students) Arthur et al., 2006
Prevention Partnerships with Schools are Necessary in this Time of No Child Left Behind • If students are to achieve their best, schools must address risk and protection to remove barriers to learning and enhance school commitment • Prevention programs like Seattle Social Development Project remove barriers to learning, motivate students to learn, and engage parents as partners in student learning
Twenty Five Years of Research on School Based Youth Development Programs • 1981-present--Seattle Social Development Project in Seattle Public Schools • 1985--1992--Raising Healthy Children in Renton Public Schools • 1993-present--Raising Healthy Children in Edmonds Public Schools
Advantages of Longitudinal Controlled Trials • Natural history of development can be studied to identify targets for intervention • Strong tests of causal hypotheses • Short and long term effects can be examined Farrington, 2004
7th Grade Prevention Targets and Academic Achievement at 10th Grade Achievement Grades Test Score Partiala rPartiala r Child Report of School Bonding .139** .134** Skills Teacher report of social skills .159** .302** Teacher report of emotional skills .168** .184** Parent report of cons. thinking .235** .213** Child report of decision making .120** .122* p < .05, ** p < .01, a=controlling for demographics and 4th grade achievement test score Fleming et al., 2005
Proactive Classroom Management Increases Bonding to School Growth in Student bonding Fall-Spring Harachi, et al, 1999
Proactive Classroom Management Increases Social Competency Growth in Social competence Fall-Spring Harachi, et al, 1999
Reading Achievement Decreases Problem Behavior Drug use Low income Covert antisocial behavior Grade 7 problem behavior Male -.25** -.30** Physical aggression Level at 3rd Grade Change from 3rd to 6th grade Grade 3 reading achievement Grade 4 reading achievement Grade 5 reading achievement Grade 6 reading achievement Fleming, et al. 2004
Advantages of Longitudinal Controlled Trials • Natural history of development can be studied to identify targets for intervention • Strong tests of causal hypotheses • Short and long term effects can be examined Farrington, 2004
Seattle Social Development ProjectLong Term Effects on Academic and Behavioral Outcomes Investigators: J. David Hawkins, Ph.D. Richard F. Catalano, Ph.D. Karl G. Hill, Ph.D. Richard Kosterman, Ph.D. Robert D. Abbott, Ph.D. Social Development Research Group School of Social Work University of Washington 9725 3rd Avenue NE, Suite 401 Seattle, Washington 98115 Funded by: National Institute on Drug Abuse, National Institute on Alcoholism and Alcohol Abuse, National Institute on Mental Health, Office of Juvenile Justice and Delinquency Prevention, Robert Wood Johnson Foundation
Seattle Social Development Project Design • Initiated in 1981 in 8 Seattle elementary schools. • Expanded in 1985, to include 18 Seattle elementary schools to add a late intervention condition and additional control students. • Quasi-experimental study • Full treatment (grades 1-6) n= 149 Late treatment (grades 5-6) n= 243 Control n= 206 • 808 (77%) of the 5th grade students constitute the longitudinal study sample.
Intervention Components • Component One: Teacher Training in ClassroomInstruction and Management • Component Two:Parent Trainingin Behavior Management and Academic Support • Component Three: Child Social, Emotional and Cognitive Skill Development
Instructional Strategies Direct Instruction • Activate Background Knowledge • Clear Objectives • Provide Input • Check for Understanding • Guided Practice • Monitor and Adjust • Feedback • Individual Practice
Instructional Strategies Cooperative Learning • Involve small teams of students of different ability levels and backgrounds as learning partners • Provide recognition to teams for academic improvement of individual members over past performance
Proactive Classroom Management • Establish consistent classroom expectations and routines at the beginning of the year • Give clear, explicit instructions for behavior • Recognize desirable student behavior and efforts to comply • Use methods that keep minor classroom disruptions from interrupting instruction
Parent Programs Raising Healthy Children (grades 1-2) • Observe and pinpoint desirable and undesirable child behaviors • Teach expectations for behaviors • Provide consistent positive reinforcement for desired behavior • Provide consistent and moderate consequences for undesired behaviors Supporting School Success (grades 2-3) • Initiate conversation with teachers about children’s learning • Help children develop reading and math skills • Create a home environment supportive of learning Guiding Good Choices (grades 5-6) • Establish a family policy on drug use • Practice refusal skills with children • Use self-control skills to reduce family conflict • Create new opportunities in the family for children to contribute and learn
Social, Cognitive and Emotional Skills Training • Listening • Following directions • Social awareness (boundaries, taking perspective of others) • Sharing and working together • Manners and civility (please and thank you) • Compliments and encouragement • Problem solving • Emotional regulation (anger control) • Refusal skills
Support Structures • School Staff • 5 days of teacher training • Coaching by teacher trainer • Principal support • Family • Training in each parenting curriculum
Middle High Elementary Adult Seattle Social Development ProjectPanel Retention School Level MEANAGE 10 11 12 13 14 15 16 (17) 18 21 24 27 N 808 703 558 654 778 783 770 -- 757 766 752 747 % 87% 69% 81% 96% 97% 95% -- 94% 95% 93% 93%
Attrition and Selection Bias • No significant differences for those lost to attrition versus those retained with respect to distribution of participants into the intervention conditions. • No significant differences between the intervention and control groups with respect to: • Gender, ethnicity, or childhood poverty • Mean years living in Seattle by grade 6 • Mean number of residences lived in from age 5 to 14 • Proportion of single-parent homes during grade 5 • Living in a disorganized neighborhood at age 16 • Family size, mother’s education, or age at time of survey
Late Full Intervention Full Intervention Control Control Seattle Social Development Project Changed Risk, Protection and Outcomes • By the start of 5th grade, those in the full intervention had • less initiation of alcohol • less initiation of delinquency • better family management • better family communication • better family involvement • higher attachment to family • higher school rewards • higher school bonding • By age 18 Youths in the Full Intervention had • less heavy alcohol use: 25.0% C vs 15.4% Full • less lifetime violence: 59.7% C vs 48.3% Full • less lifetime sexual activity: 83.0% C vs 72.1% Full • fewer lifetime sex partners: 61.5% C vs 49.7% Full • improved school bonding • less grade repetition: 22.8% C vs 14.0% Full • reduced school discipline rpts:58.0% C vs 46.0% Full • Intervention has specific benefits for children from poverty through age 18. • More attachment to school • Fewer held back in school • Better achievement • Less school misbehavior • Less drinking and driving • By age 21, broad significant effects were found on positive adult functioning: • More high school graduates • More attending college • More employed • Fewer depressive symptoms: 2.93 C vs 2.31 Full • Fewer with a criminal record: 53% C vs 42% Full • Less drug selling: 13% C vs 4% Full • Fewer females were pregnant: 40% C vs 23% Full • Fewer STD’s among African American:34% C vs 7% Full • At the end of the 2nd grade • boys less aggressive • girls less self-destructive Late Grade Age
Seattle Social Development Project Effects at Age 12:California Achievement Test Scores *p<.05 compared with controls; N = 548 to 551.
Seattle Social Development Project Effects at Age 21: Education * Prevalence * *p<.05 compared with controls.
$3.14 $1.00 Cost-Benefit An independent cost-benefit analysis estimated that projected benefits resulting from the SSDP intervention would produce a net positive return per participant. Aos et al. (2004)
Summary • Academic competence, delinquency and drug use all affect school success • The same longitudinal predictors affect academic competence, delinquency and drug use • Addressing these predictors by improving teaching practices, family management skills, and children’s skills can enhance academic success and prevent multiple problems across development • Promoting positive development in elementary grades can prevent problems before they occur, reducing costs to society
Society for Research on Educational EffectivenessDecember 11, 2006 Reducing Risk and Enhancing Protection to Remove Barriers to Learning Richard F. Catalano, Director Social Development Research Group University of Washington www.sdrg.org
Building Level Exposure to Risk and Protection PredictsStandardized Achievement Test Scores Washington Assessment of Student Learning (WASL) standardized achievement test scores of the school’s 10th grade students Youth Survey measures of a school’s average number of elevated risk and protective factors among their 10th grade students Data on 82,030 students in 423 schools and 156 school districts collected in 2002-03 at the school building level
Social Development Approach • Social Development approaches attempt to change the environment and the individual to reduce risk and enhance protection across development
Teaching Practices are Changed Through RHC Intervention * Mean observed score * Teaching Practices Effect size: Cohen’s d=.45 Cohen’s d=.34 Fleming, nd. *P<.05
Least amount of time Least amount of teacher effort Least amount of negative attention on student Least unpleasant feeling Least disruption to the learning environment Eye contact Proximity Pause First/Then Encouraging desirable behavior Cueing Humor Empathy Modify instruction Proactive School and Classroom Management- Law of Least Intervention