Download
1 / 18
180 likes | 357 Views
Air toxics measurements in a Seattle neighborhood. Doris Montecastro and Hal Westberg Laboratory for Atmospheric Research Dept. of Civil and Environmental Eng. Washington State University Pullman, WA 99164-2910. Primary Goals. Characterize ambient air toxics concentrations

E N D
Air toxics measurements in a Seattle neighborhood Doris Montecastro and Hal Westberg Laboratory for Atmospheric Research Dept. of Civil and Environmental Eng. Washington State University Pullman, WA 99164-2910
Primary Goals • Characterize ambient air toxics concentrations • Evaluate spatial and temporal variability of ambient air toxics • Evaluate modeled results • Support health effects studies
Long Term Goals • Estimate source apportionment (statistical and air quality models ) • Assess long term trends • Evaluate effectiveness of air toxics reduction strategies
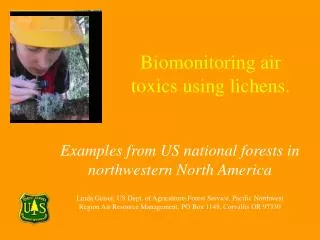
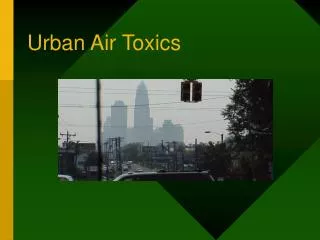
Outline • Introduction A. Urban Air Toxics B. Common Sources • Methods A. Site B. Analytical Methods III. Data (2004) IV. Results V. Conclusions and Recommendations
Introduction • Continuation of the monitoring started in 2000 • Seattle is one of the original 4 large cities in the 10-site Pilot Monitoring Project • Currently, one of the 23 sites in the National Air Toxic Trends (NATTS) network • Neighborhood-scale measurements (0.5 – 4 km2) • Volatile organic compound (VOC), carbonyl and PM-10 measurements will be presented (although metals were also measured)
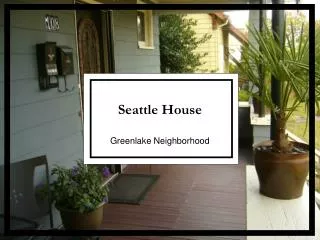
Sampling Site: Beacon Hill • 24-hr integrated samples collected every 6th day • Duplicates also collected for VOCs and carbonyls
Analytical Methods TO–14A (GC with FID/ECD) • benzene • 1,3-butadiene • CCl4 • Chloroform • Trichloroethylene (TCE) • Tetrachloroethylene (PCE) TO-11A (DNPH cartridge with HPLC) • Acetaldehyde • Formaldehyde • Gravimetric • PM-10
Results: Correlation Coefficients Chloroform has very poor correlation with other VOCs
Results: Chloroform August 25, 2004 [chloroform] = 0.010 ppbv WD = S WS = 6 m/s T = 16C Waterreservoir April 9, 2004 [chloroform] = 0.127 ppbv WD = NE, NW WS = 2 m/s T = 10C
Results: Nov. 5, 2004 (high levels) T = 4C WS = 5 m/s
Results: July 20, 2004 (low levels) T = 18C WS = 3 m/s
Conclusions and Recommendations • Chloroform does not correlate with the other VOCs, implying a unique source • Trends observed in previous years still present • High benzene, 1,3-butadiene, TCE and PCE during winter • High acetaldehyde and formaldehyde during summer • Ambient concentrations almost an order of magnitude greater for most species • Evaluate spatial and temporal variability • Compare with modeled results
Acknowledgments • John Williamson, WA DOE • Lee Bamesberger, WSU LAR • Jenny Filipy, WSU LAR • Gene Allwine, WSU LAR • WA Dept. of Ecology and US EPA for financial support