Download
1 / 10
100 likes | 261 Views
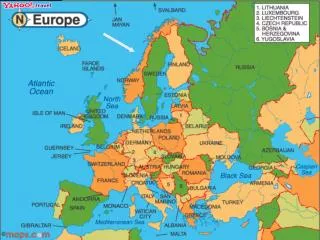
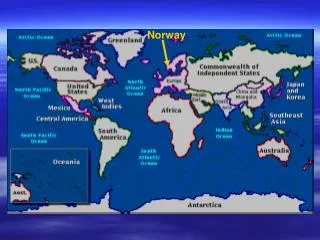
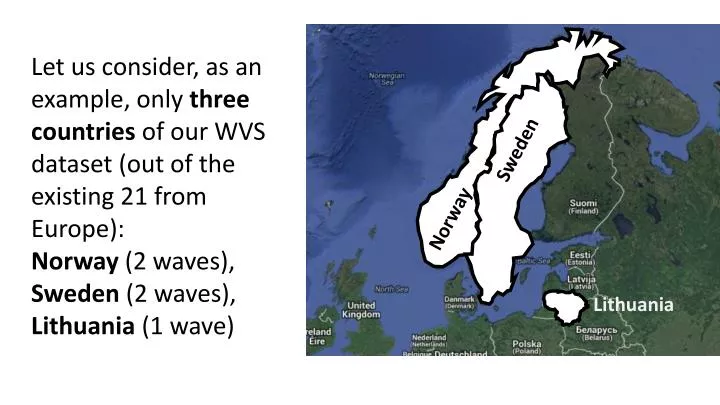
Let us consider, as an example, only three countries of our WVS dataset (out of the existing 21 from Europe): Norway (2 waves), Sweden (2 waves), Lithuania (1 wave ). Sweden. Norway. Lithuania.

E N D
Let us consider, as an example, only three countries of our WVS dataset (out of the existing 21 from Europe): Norway (2 waves), Sweden (2 waves), Lithuania (1 wave) Sweden Norway Lithuania
Let us focus on threecountries and on one domain only: Genderattitudes of the respondents. Norway 2056 We form clusters(5 in this example) on the basis of the degree of agreement with sentences like: when jobs are scarce, men should be preferred to women (3) Being a housewife is fulfilling (4) Men make better political leaders (4) University is more important for boys (4) The feminist movement is trustworthy (4) (N = number of options) Sweden 1668 Lithuania 609
Clusters group respondents with similar views (no matter which) Norway CL1 2056 797 1767 CL2 CL3 Sweden 1668 1286 CL4 Lithuania CL5 609 483
Clusters group respondents with similar views (no matter which) Norway CL1 797 1767 1576 0 CL2 498 1004 CL3 Sweden 1286 0 1186 1883 CL4 201 Lithuania CL5 483 0 276
What matters is the proportion of respondents from the same clusters within countries: NO, ... 74 2056 3,6% Norway CL1 CL2 917 44,6% 585 CL3 28,5% Sweden 191 9,3% 289 14,1% CL4 Lithuania CL5
What matters is the proportion of respondents from the same clusters within countries: NO, SE, LT 74 3,6% 100% Norway CL1 CL2 41 917 44,6% 741 585 CL3 28,5% Sweden 404 9,3% 289 100 14,1% 86 CL4 175 Lithuania CL5 15 382 207 126
74 3,6% 100% Norway CL1 CL2 41 2,5% 917 We now measure how close the distributions are (Within-country distributions of respondents who share similar views) 44,6% 741 44,4% 585 CL3 28,5% Sweden 404 24,2% 9,3% 289 14,1% 14,1% 86 CL4 100 6,0% 28,7% 175 Lithuania CL5 2,5% 15 22,9% 207 34,0% 20,7% 126
3,6% Norway Summary table We consider proportions: not one by one... 2,5% 44,6% 44,4% 28,5% ...but an overall synthetic measure (sum of squared differences) Sweden 24,2% 9,3% 14,1% 14,1% 6,0% 28,7% Lithuania 2,5% 34.0% 22,9% 20,7%
Sweden VS Lithuania 22,9% 20,7% 6,0% 34.0% 24,2% 2,5% 44,4% 28,7% Norway Sweden VS 2,5% 14,1% 2 2 2 2 2 2 2 2 2 2 2 2 2 2 2 + + + 14,1% 22,9% 0,164 + + + 9,3% 6,0% Norway Lithuania VS + + + 28,5% 24,2% 14,1% 20,7% + + + 44,6% 44,4% 9,3% 34.0% 3,6% 2,5% = = = 28,5% 2,5% 44,6% 28,7% 0,011 3,6% 14,1% 0,169