Download
1 / 25
260 likes | 404 Views
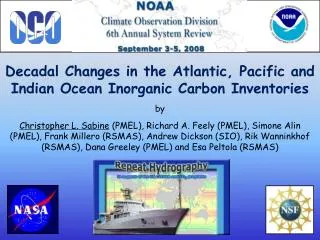
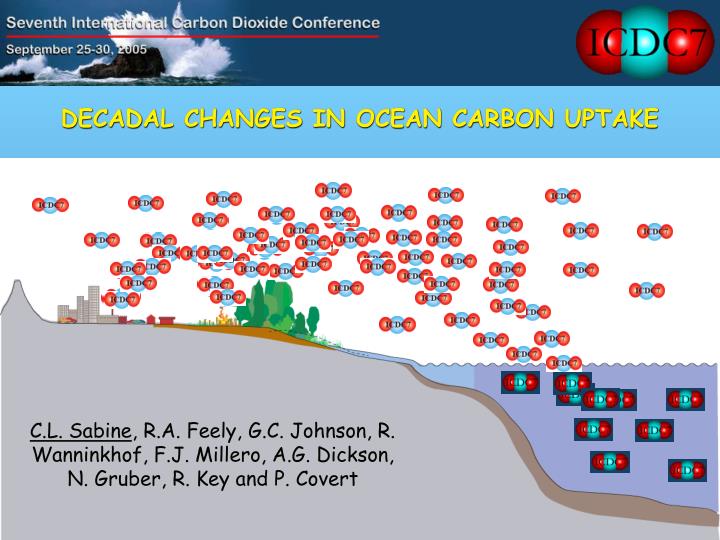
DECADAL CHANGES IN OCEAN CARBON UPTAKE. C.L. Sabine , R.A. Feely, G.C. Johnson, R. Wanninkhof, F.J. Millero, A.G. Dickson, N. Gruber, R. Key and P. Covert. DECADAL CHANGES IN OCEAN CARBON UPTAKE.

E N D
DECADAL CHANGES IN OCEAN CARBON UPTAKE C.L. Sabine, R.A. Feely, G.C. Johnson, R. Wanninkhof, F.J. Millero, A.G. Dickson, N. Gruber, R. Key and P. Covert
DECADAL CHANGES IN OCEAN CARBON UPTAKE C.L. Sabine, R.A. Feely, G.C. Johnson, R. Wanninkhof, F.J. Millero, A.G. Dickson, N. Gruber, R. Key and P. Covert
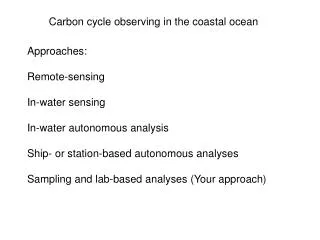
Outline • Briefly review recent improvements in ocean carbon uptake estimates. • Discuss observational approaches for estimating changes in ocean uptake. • Illustrate a new potential approach for extrapolating ocean carbon measurements to basin and global scales. • Briefly touch on future needs.
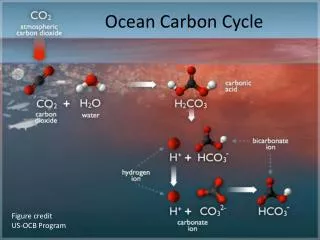
Pre 1990s view of the global carbon cycle Source: LDEO A missing carbon sink?
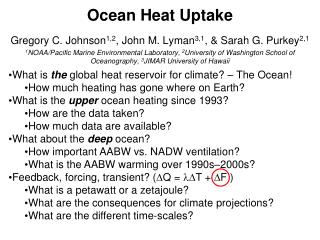
WOCE/JGOFS/OACES Global CO2 Survey http://cdiac.esd.ornl.gov/oceans/glodap/Glodap_home.htm ~72,000 sample locations collected in the 1990s DIC ± 2 µmol kg-1 TA ± 4 µmol kg-1 Anthropogenic CO2 Column Inventory (mol/m2) Mapped Inventory = 106±17 Pg C + marginal seas = 6± 6 Pg C + Arctic Ocean = 6± 6 Pg C Total Inventory = 118±19 Pg C Sabine et al., 2004
Recent assessments of 1990s ocean uptake Sabine and Feely, 2005
36% 43% 29% + to - 13-23% 55-26% Sabine and Feely, 2005 First 180 years the ocean absorbed 44% of emissions Last 20 years the ocean absorbed 36% of emissions
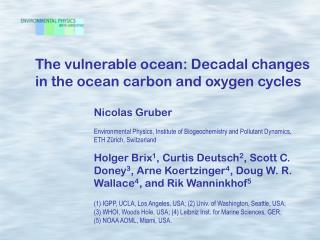
Is Ocean Carbon Uptake Changing with Time? If so, how do we monitor and understand these changes? OSP KNOT ESTOC BATS HOT NZTS One way is through long time-series measurements of carbon
U.S. JGOFS Time Series Measurements Keeling et al. (2004) Gruber et al. (2002) From: N. Gruber There are regional differences in the rate of ocean carbon increases
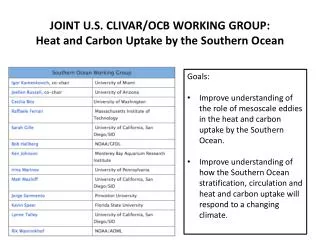
Another approach is CLIVAR/CO2 Repeat Hydrography Goal: To quantify decadal changes in the inventory and transport of heat, fresh water, carbon dioxide (CO2), chlorofluorocarbon tracers and related parameters in the oceans. Approach: Reoccupy a subset of the WOCE/JGOFS global survey cruises approximately every decade. The US has identified 19 cruises to be run over 10 years.
U.S. CLIVAR/CO2 Repeat Hydrography Achievements: The U.S. CLIVAR/CO2 Repeat Hydrography Program has completed 6 of 19 cruises and is on schedule. For further details see: http://ushydro.ucsd.edu/ A16N June ‘03 A20 Sept. ‘03 P16S Jan. ‘05 A16S Jan. ‘05 P2 June. ‘04 A22 Oct. ‘03
Obtaining the decadal anthropogenic CO2 signal in the ocean Pressure (dbar) DIC (µmol/kg) Multiple Linear Regression Approach Pressure (dbar) DIC = a + bT + cS + dAOU + eNO3 • Fit older cruise DIC as a function of non-carbon tracers • Use non-carbon tracers from new cruise to predict DIC • Examine difference between measured DIC and predicted ∆DIC (µmol/kg) Pressure (dbar)
CO2 Accumulation Rate on Isopycnal Surfaces along 30°N Based on P2 2004 - 1994 Comparison Vertically Integrated Accumulation: 1.1±0.1 mol m-2 yr-1
Preliminary results suggest that North Atlantic accumulation rate over the last decade may have been about half of the North Pacific accumulation rate. Water column Accumulation ~ .6 mol/m2/yr Surface Accumulation 0.7 µmol/kg/yr Surface Accumulation 1.3 µmol/kg/yr Water column Accumulation ~ 1.1 mol/m2/yr This appears to be a change from the historical operation of these basins.
∆CT = DIC m - DICMLR North Pacific Zonal section 2004-1994 North Atlantic Meridional section 2003-1997 For more information see Feely et al. and Wanninkhof et al. posters ∆DIC (µmol/kg)
How do we take observations from a few regions and evaluate basin-scale or global changes in uptake rate? Water column Accumulation ~ .6 mol/m2/yr Surface Accumulation 0.7 µmol/kg/yr Surface Accumulation 1.3 µmol/kg/yr Water column Accumulation ~ 1.1 mol/m2/yr As we continue to expand our observational data base we need to focus on how to extrapolate results to basin and global scales
Is it possible to use ARGO to estimate carbon changes? Approach: Use MLR fits of shipboard data (A16N, A22, A20) to derive functions to estimate carbon from ARGO profiles. Measured Parameters: T, S, P, Lat., Lon. 2003 N. A. ARGO Profiles http://www.argo.ucsd.edu/
Examined Fits for a Variety of Carbon Parameters Rmse = 5.6 µmol/kg Rmse = 4.4 µmol/kg Rmse = 11.4 µmol/kg Measured Parameters: Temperature, Salinity, Pressure, Latitude, Longitude Physical Parameters used in MLR Fits: Potential Temperature (θ), Salinity (S), Potential Density (σθ), Spiciness (π), Brunt-Vaisala frequency(N2) C* = DIC+0.688oxy- 0.5(Talk-0.094oxy) Dissolved Inorganic Carbon Total Alkalinity Rmse = 5.6 µmol/kg Rmse = 11.4 µmol/kg Rmse = 4.4 µmol/kg C* = DIC+0.688oxy- 0.5(Talk-0.094oxy)
Maps of North Atlantic C* Distributions • Approach: • Use fits of modern hydrographic sections with ARGO profiles from same year to map C* values across basin. • Map C* values from WOCE cruises • Subtract WOCE maps from modern maps to determine anthropogenic accumulation. ARGO based C* distributions agree well with data along sections and maps are consistent with expected patterns. WOCE C* maps appear to have significant mapping errors due to extrapolation between cruises.
Another complication with C* approach is the assumption of constant Redfield ratios. ∆AOU * 0.688 (µmol/kg) There appear to be large AOU changes on A16N that are of comparable magnitude to DIC changes.
Adding Oxygen Greatly Improves The Fit Rmse = 11.4 µmol/kg without oxygen Rmse =3.7 µmol/kg with oxygen Adding oxygen to the global ARGO data base will make these data much more relevant for biogeochemical studies.
The technology is ready and being implemented by a handful of investigators, but needs large-scale implementation to be most effective Phase 2: Add pH to ARGO and use MLR fits of alk. to calculate full carbon system
Conclusions • Comparison of inventory changes over the first 180 years of the anthropocene with uptake rates for the last 20 years suggest that the ocean uptake is not able to keep up with atmospheric growth rate. • Time series and repeat hydrography data suggest that the North Atlantic uptake rate has been about half of the North Pacific rate for the last decade. • We are continuing to examine additional regions, but need to develop improved techniques for extrapolating results to basin and global scales. • Correlations between carbon and ARGO data are promising, but addition of oxygen sensors would greatly improve usefulness for biogeochemical studies.
Thank You! On to our Next Cruise - P16N in 2006!
NAO- PDO+ NAO+