Download
1 / 42
450 likes | 477 Views
B cell epitopes and predictions. Pernille Haste Andersen, Ph.d. student Immunological Bioinformatics CBS, DTU. B cells and antibodies. Antibodies are produced by B lymphocytes (B cells) Antibodies circulate in the blood They are referred to as “the first line of defense” against infection

E N D
B cell epitopes and predictions Pernille Haste Andersen, Ph.d. student Immunological Bioinformatics CBS, DTU
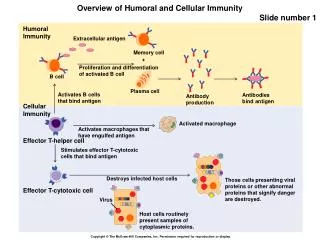
B cells and antibodies • Antibodies are produced by B lymphocytes (B cells) • Antibodies circulate in the blood • They are referred to as “the first line of defense” against infection • Antibodies play a central role in immunity by attaching to pathogens and recruiting effector systems that kill the invader
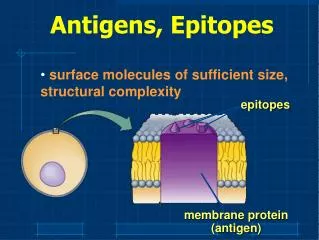
What is a B cell epitope? B cell epitopes • Accessible and recognizable structural feature of a pathogen molecule (antigen) • Antibodies are developed to bind the epitope with high affinity by using the complementarity determining regions (CDRs) Antibody Fab fragment B cell epitope
Motivations for prediction of B cell epitopes • Prediction of B cell epitopes can potentially guide experimental epitope mapping • Predictions of antigenicity in proteins can be used for selecting subunits in rational vaccine design • Predictions of B cell epitopes may also be valuable for interpretation of results from experiments based on antibody affinity binding such as ELISA, RIA
Computational Rational Vaccine Design >PATHOGEN PROTEIN KVFGRCELAAAMKRHGLDNYRGYSLGNWVCAAKFESNF Rational Vaccine Design
B cell epitopes, linear or discontinuous? • Classified into linear (~10%) and discontinuous epitopes (~90%) • Databases: AntiJen, IEDB, BciPep, Los Alamos HIV database, Protein Data Bank • Large amount of data available for linear epitopes • Few data available for discontinuous epitopes • In general, B cell epitope prediction methods have relatively low performances
Discontinuous B cell epitopes An example: The epitope of the outer surface protein A from Borrelia Burgdorferi (1OSP) • SLDEKNSVSVDLPGEMKVLVSKEKNKDGKYDLIATVDKLELKGTSDKNNGSGVLEGVKADKCKVKLTISDDLGQTTLEVFKEDGKTLVSKKVTSKDKSSTEEKFNEKGEVSEKIITRADGTRLEYTGIKSDGSGKAKEVLKG • ..\Discotope\1OSP_epitope\1OSP_epitope.psw
The binding interactions • Salt bridges • Hydrogen bonds • Hydrophobic interactions • Van der Waals forces Binding strength
B-cell epitopes are dynamic • Many of the charged groups and hydrogen bonding partners are present on highly flexible amino acid side chains. • Most crystal structures of epitopes and antibodies in free and complexed forms have shown conformational rearrangements upon binding. • “Induced fit” model of interactions.
B-cell epitope classification B-cell epitope – structural feature of a molecule or pathogen, accessible and recognizable by B-cells Linear epitopes One segment of the amino acid chain Discontinuous epitope (with linear determinant) Discontinuous epitope Several small segments brought into proximity by the protein fold
B-cell epitope annotation • Linear epitopes: • Chop sequence into small pieces and measure binding to antibody • Discontinuous epitopes: • Measure binding of whole protein to antibody • The best annotation method : X-ray crystal structure of the antibody-epitope complex
B-cell epitope data bases • Databases: AntiJen, IEDB, BciPep, Los Alamos HIV database, Protein Data Bank • Large amount of data available for linear epitopes • Few data available for discontinuous
Sequence-based methods for prediction of linear epitopes • Protein hydrophobicity – hydrophilicity algorithms Parker, Fauchere, Janin, Kyte and Doolittle, Manavalan Sweet and Eisenberg, Goldman, Engelman and Steitz (GES), von Heijne • Protein flexibility prediction algorithm Karplus and Schulz • Protein secondary structure prediction algorithms GOR II method (Garnier and Robson), Chou and Fasman, Pellequer • Protein “antigenicity” prediction : Hopp and Woods, Welling TSQDLSVFPLASCCKDNIASTSVTLGCLVTGYLPMSTTVTWDTGSLNKNVTTFPTTFHETYGLHSIVSQVTASGKWAKQRFTCSVAHAESTAINKTFSACALNFIPPTVKLFHSSCNPVGDTHTTIQLLCLISGYVPGDMEVIWLVDGQKATNIFPYTAPGTKEGNVTSTHSELNITQGEWVSQKTYTCQVTYQGFTFKDEARKCSESDPRGVTSYLSPPSPL
Propensity scales: The principle D 2.46 E 1.86 N 1.64 S 1.50 Q 1.37 G 1.28 K 1.26 T 1.15 R 0.87 P 0.30 H 0.30 C 0.11 A 0.03 Y -0.78 V -1.27 M -1.41 I -2.45 F -2.78 L -2.87 W -3.00 • The Parker hydrophilicity scale • Derived from experimental data Hydrophilicity
Propensity scales: The principle ….LISTFVDEKRPGSDIVEDLILKDENKTTVI…. (-2.78 + -1.27 + 2.46 +1.86 + 1.26 + 0.87 + 0.3)/7 = 0.39 Prediction scores: 0.38 0.1 0.6 0.9 1.0 1.2 2.6 1.0 0.9 0.5 -0.5 Epitope
Evaluation of performance • A Receiver Operator Curve (ROC) is useful for finding a good threshold and rank methods
Turn prediction and B-cell epitopes • Pellequer found that 50% of the epitopes in a data set of 11 proteins were located in turns • Turn propensity scales for each position in the turn were used for epitope prediction. 1 4 2 Pellequer et al., Immunology letters, 1993 3
Blythe and Flower 2005 • Extensive evaluation of propensity scales for epitope prediction • Conclusion: • Basically all the classical scales perform close to random! • Other methods must be used for epitope prediction
BepiPred: CBS in-house tool • Parker hydrophilicity scale • Hidden Markov model • Markov model based on linear epitopes extracted from the AntiJen database • Combination of the Parker prediction scores and Markov model leads to prediction score • Tested on the Pellequer dataset and epitopes in the HIV Los Alamos database
ROC evaluation Evaluation on HIV Los Alamos data set
BepiPred performance • Pellequer data set: • Levitt AROC = 0.66 • Parker AROC = 0.65 • BepiPred AROC = 0.68 • HIV Los Alamos data set • Levitt AROC = 0.57 • Parker AROC = 0.59 • BepiPred AROC = 0.60
BepiPred • BepiPred conclusion: • On both of the evaluation data sets, Bepipred was shown to perform better • Still the AROC value is low compared to T-cell epitope prediction tools! • Bepipred is available as a webserver: www.cbs.dtu.dk/services/BepiPred
How can we get information about the three-dimensional structure? Structural determination • X-ray crystallography • NMR spectroscopy Both methods are time consuming and not easily done in a larger scale Structure prediction • Homology modeling • Fold recognition Less time consuming, but there is a possibility of incorrect predictions, specially in loop regions
Protein structure prediction methods • Homology/comparative modeling >25% sequence identity (seq 2 seq alignment) • Fold-recognition/threading <25% sequence identity (Psi-blast search/ seq 2 str alignment) • Ab initio structure prediction 0% sequence identity
A data set of 3D discontinuous epitopes • A data set of 75 discontinuous epitopes was compiled from structures of antibodies/protein antigen complexes in the PDB • The data set has been used for developing a method for predictions of discontinuous B cell epitopes • Since about 30 of the PDB entries represented Lysozyme, I have used homology grouping (25 groups of non-homologous antigens) and 5 fold cross-validation for training of the method • Performance was measured using ROC curves on a per antigen basis, and by weighted averaging of AUC values
Epitope log-odds ratios • Frequencies of amino acids in epitopes compared to frequencies of non-epitopes • Several discrepancies compared to the Parker hydrophilicity scale which is often used for epitope prediction • Both methods are used for predictions using a sequential average of scores • Predictive performance of B cell epitopes: • Parker 0.614 AUC • Epitope log–odds 0.634 AUC
3D information: Contact numbers • Surface exposure and • structural protrusion can • be measured by residue • contact numbers • The predictive performance: • Parker 0.614 AUC • Epitope log–odds 0.634 AUC • Contact numbers 0.647 AUC
DiscoTope : Prediction of Discontinuous epitopes using 3D structures • A combination of: • Sequentially averaged epitope log-odds values of residues in spatial proximity • Contact numbers .LIST..FVDEKRPGSDIVED……ALILKDENKTTVI. -0.145 +0.691+0.346+1.136+1.180+1.164 +1.136 +0.346 Sum of log-odds values Contact number : K 10 DiscoTope prediction value
DiscoTope : Prediction of Discontinuous epiTopes • Improved prediction of residues in discontinuous B cell epitopes in the data set • The predictive performance on B cell epitopes: Parker 0.614 AUC Epitope log–odds 0.634 AUC Contact numbers 0.647 AUC DiscoTope 0.711 AUC
Evaluation example AMA1 • Apical membrane antigen 1 from Plasmodium falciparum (not used for training/testing) • Two epitopes were identified using phage-display, point-mutation (black side chains) and sequence variance analysis (side chains of polyvalent residues in yellow) • Most residues identified as epitopes were successfully predicted by DiscoTope (green backbone) ..\Discotope\1Z40_epitope\1Z40_movie.mov DiscoTope is available as web server: http://www.cbs.dtu.dk/services/DiscoTope/
Future improvements • Add epitope predictions for protein-protein complexes • Visualization of epitopes integrated in web server • Testing a score for sequence variability fx based on entropy of positions in the antigens • Combination with glycosylation site predictions • Combination with predictions of trans-membrane regions • Assembling predicted residues into whole epitopes
Use the CEP server • Conformational epitope server http://202.41.70.74:8080/cgi-bin/cep.pl • Uses protein structure as input • Finds stretches in sequences which are surface exposed
Use the DiscoTope server • CBS server for prediction of discontinuous epitopes • Uses protein structure as input • Combines propensity scale values of amino acids in discontinuous epitopes with surface exposure • www.cbs.dtu.dk/services/DiscoTope
Rational vaccine design >PATHOGEN PROTEIN KVFGRCELAAAMKRHGLDNYRGYSLGNWVCAAKFESNF Rational Vaccine Design
Rational B-cell epitope design • Protein target choice • Structural analysis of antigen • Known structure or homology model • Precise domain structure • Physical annotation (flexibility, electrostatics, hydrophobicity) • Functional annotation (sequence variations, active sites, binding sites, glycosylation sites, etc.) Model Known 3D structure
Rational B-cell epitope design • Protein target choice • Structural annotation • Epitope prediction and ranking • Surface accessibility • Protrusion index • Conserved sequence • Glycosylation status
Rational B-cell epitope design • Protein target choice • Structural annotation • Epitope prediction and ranking • Optimal Epitope presentation • Fold minimization, or • Design of structural mimics • Choice of carrier (conjugates, DNA plasmids, virus like particles) • Multiple chain protein engineering
Multi-epitope protein design B-cell epitope Rational optimization of epitope-VLP chimeric proteins: • Design a library of possible linkers (<10 aa) • Perform global energy optimization in VLP (virus-like particle) context • Rank according to estimated energy strain T-cell epitope
Conclusions • Selection of protective B-cell epitopes involves structural, functional and immunogenic analysis of the pathogenic proteins • When you can: Use protein structure for prediction • Structural modeling tools are helpful in prediction of epitopes, design of epitope mimics and optimal epitope presentation