Download
1 / 47
470 likes | 617 Views
Neutrino Interaction measurements in MiniBooNE. hep-ex/0706.0926. Teppei Katori and D. Chris Cox for the MiniBooNE collaboration Indiana University PMN07, Blaubeuren, July, 03, 07. Neutrino Interaction measurements in MiniBooNE. hep-ex/0706.0926.

E N D
Neutrino Interaction measurements in MiniBooNE hep-ex/0706.0926 Teppei Katori and D. Chris Cox for the MiniBooNE collaboration Indiana University PMN07, Blaubeuren, July, 03, 07 Teppei Katori, Indiana University, PMN07
Neutrino Interaction measurements in MiniBooNE hep-ex/0706.0926 outline1. CCQE events in MiniBooNE2. Prediction for CCQE events3. CCQE data-MC comparison4. Fit results5. Anti-neutrino CCQE events6. Neutral Current Elastic events7. SciBooNE experiment8. Conclusion Teppei Katori, Indiana University, PMN07
1. CCQE events in MiniBooNE Teppei Katori, Indiana University, PMN07
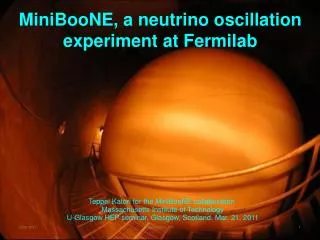
1. CCQE events in MiniBooNE nmcharged current quasi-elastic (nmCCQE) interaction is the most abundant (~40%) and the fundamental interaction in MiniBooNE detector MiniBooNE detector (spherical Cherenkov detector) 12C n Teppei Katori, Indiana University, PMN07
1. CCQE events in MiniBooNE nmcharged current quasi-elastic (nmCCQE) interaction is the most abundant (~40%) and the fundamental interaction in MiniBooNE detector MiniBooNE detector (spherical Cherenkov detector) muon like Cherenkov light and subsequent decayed electron (Michel electron) like Cherenkov light are the signal of CCQE event Cherenkov 1 e m n-beam 12C Cherenkov 2 n p (Scintillation) Teppei Katori, Indiana University, PMN07
1. CCQE events in MiniBooNE nm CCQE interactions (n+n m+p) has characteristic two “subevent” structure from muon decay nm+ n m+ pmnm +`ne + e muon >200 hits 35.0% cut efficiency 197,308 events with 5.58E20POT Michel electron <200 hits Teppei Katori, Indiana University, PMN07
2. Prediction for CCQE events Teppei Katori, Indiana University, PMN07
2. Prediction for CCQE events Predicted event rates (NUANCE Monte Carlo) Casper, Nucl.Phys.Proc.Suppl. 112 (2002) 161 Teppei Katori, Indiana University, PMN07
2. Prediction for CCQE events Smith and Moniz, Nucl.,Phys.,B43(1972)605 Relativistic Fermi Gas (RFG) Model Carbon is described by the collection of incoherent Fermi gas particles. All details come from hadronic tensor. Teppei Katori, Indiana University, PMN07
2. Prediction for CCQE events Smith and Moniz, Nucl.,Phys.,B43(1972)605 Relativistic Fermi Gas (RFG) Model Carbon is described by the collection of incoherent Fermi gas particles. All details come from hadronic tensor. 3 parameters are especially important to control nuclear effect of Carbon; MA = 1.03GeV : axial mass PF = 220MeV : Fermi momentum EB = 34MeV : binding energy Teppei Katori, Indiana University, PMN07
3. CCQE data-MC comparison Teppei Katori, Indiana University, PMN07
3. CCQE data-MC comparison Nuclear model parameters are tuned from electron scattering data, thus the best explanations of observed data-MC disagreements are something one cannot measure from the electron scattering data (1) data deficit at low Q2 region Pauli blocking parameter kappa: k (2) data excess at high Q2 region Axial mass MA We tune the nuclear parameters in RFG model using Q2 distribution; MA = tuned PF = fixed EB = fixed k = tuned Teppei Katori, Indiana University, PMN07
4. Fit results Teppei Katori, Indiana University, PMN07
4. Fit results MA - k fit result MA = 1.23 ± 0.20(stat+sys) k = 1.019 ± 0.011(stat+sys) circle: before fit star: after fit with 1-sigma contour triangle: bkgd shape uncertainty dots : data with error bar dashed line : before fit solid line : after fit dotted line : background dash-dotted :non-CCQElike bkgd Teppei Katori, Indiana University, PMN07
4. Fit results MA - k fit result MA = 1.23 ± 0.20(stat+sys) k = 1.019 ± 0.011(stat+sys) data-MC ratio before the fit Although fit is done in Q2 distribution, entire CCQE kinematics is improved before c2/dof = 79.5/53, P(c2) = 1% i after c2/dof = 45.1/53, P(c2) = 77% data-MC ratio after the fit Teppei Katori, Indiana University, PMN07
4. Fit results En distribution cosqm distribution Other kinematics distribution also show very good data-MC agreement (This is critical for MiniBooNE neutrino oscillation search experiment) MiniBooNE collaboration, PRL98(2007)231801 Teppei Katori, Indiana University, PMN07
5. Anti-neutrino CCQE events Teppei Katori, Indiana University, PMN07
5. Anti-neutrino CCQE events data with stat error Anti-neutrino Q2 distribution MiniBooNE anti-neutrino CCQE 8772 events (1651 total for pre-MiniBooNE data) We use same cut with neutrino mode The values of MA and k extracted from neutrino mode are employed to anti-neutrino MC, and they describe data Q2 distribution well. Anti-neutrino Q2 distribution Preliminary Teppei Katori, Indiana University, PMN07
5. Anti-neutrino CCQE events MA = 1.23GeV, k=1.019 data with stat error Anti-neutrino CCQE kinematics MiniBooNE anti-neutrino CCQE 8772 events (1651 total for pre-MiniBooNE data) We use same cut with neutrino mode The values of MA and k extracted from neutrino mode are employed to anti-neutrino MC, and they describe data Q2 distribution well. Anti-neutrino CCQE kinematics variables are described by the MC well, too. `n kinematics Preliminary Teppei Katori, Indiana University, PMN07
6. Neutral Current Elastic events Teppei Katori, Indiana University, PMN07
6. Neutral Current Elastic events Ds (strange quark spin component in the nucleon) it can be measured by neutrino-nucleon Neutral Current Elastic (NCE) scattering and Ds gives the connection between elastic scattering physics and DIS physics Axial current (neutrino physics) Polarized strange quark PDF (spin physics) SMC (~ -0.1) HERMES (~ 0.0) BNL E734 (~ -0.2) Ds is interesting open question! Teppei Katori, Indiana University, PMN07
6. Neutral Current Elastic events Prompt hits fraction protons m-decay e time distribution electrons prompt Cherenkov delayed scintillation NCE events in MiniBooNE - low tank hits (no Cherenkov) - time structure (scintillation is slower) -> 84% NCE purity Teppei Katori, Indiana University, PMN07
6. Neutral Current Elastic events MiniBooNE predicts 5:4 ratio NC p : NC n cross sections Currently we cannot measure the Ds, because non-zero Ds increases/decreases s(NCp)/s(NCn) however, we can measure the ensemble of s(NCp) and s(NCn), which can be used for MA extraction (ongoing project) ensemble NCE cross section shows good agreement with BNL E734 Teppei Katori, Indiana University, PMN07
7. SciBooNE experiment Teppei Katori, Indiana University, PMN07
7. SciBooNE MiniBooNE beamline SciBar Decay region MiniBooNE Detector 50 m 440 m 100 m QE DIS 250km 1p SciBar detector (used by K2K experiment) is shipped from Japan. Goal of SciBooNE is to measure the cross section around 0.8GeV, where the most important energy scale for T2K experiment. MINOS, NuMI K2K, NOvA MiniBooNE, T2K, SciBooNE Teppei Katori, Indiana University, PMN07
7. SciBooNE n SciBar detector Extruded scintillators with WLS fiber readout by multi-anode PMT Extruded scintillator (15t) 3m Multi-anode PMT (64 ch.) 3m Wave-length shifting fiber 1.7m Teppei Katori, Indiana University, PMN07
7. SciBooNE e m n EC (electron catcher) lead with scintillation fiber "Spaghetti" calorimeter to see electrons EM calorimeter 3m 3m MRD (Muon Range Detector) iron plates with X-Y scintillator panels Measure the muon momentum up to 1.2GeV 1.7m Teppei Katori, Indiana University, PMN07
7. SciBooNE SciBar installation Teppei Katori, Indiana University, PMN07
7. SciBooNE MRD installation Stay tuned... Teppei Katori, Indiana University, PMN07
7. SciBooNE Mar. 2005 K2K ends Nov. 2005 SciBooNE is proposed Dec. 2005 Approved Mar. 2006 First collaboration meeting Jul. 2006 SciBar arrived from Japan Sep. 2006 Groundbreaking Apr. 2007 SciBar assembly completed Apr. 2007 Detectors move to the hall May. 2007 Cabling (~15,000 channel) Jun. 2007 SciBooNE started to take anti-neutrino beam data In SciBooNE, students can work all components of the experiment, including hardware, software, analysis, and the publication we need this kind of experiment for students First neutrino candidate event in SciBooNE (May 30, 07) Teppei Katori, Indiana University, PMN07
8. Conclusion MiniBooNE successfully employee RFG model with appropriate parameter choices for MA and k for CCQE data The best fit parameters for MiniBooNE CCQE data are; MA = 1.23 ± 0.20(stat+sys) k = 1.019 ± 0.011(stat+sys) The paper is available on online hep-ex/0706.0926, submitted to PRL Our new model also works well in anti-neutrino data Neutral Current Elastic events cross section is measured SciBooNE experiment started to take data since June 2007 MiniBooNE is currently taking the data with anti-muon neutrino beam Teppei Katori, Indiana University, PMN07
MiniBooNE collaboration University of Alabama Los Alamos National Laboratory Bucknell University Louisiana State University University of Cincinnati University of Michigan University of Colorado Princeton University Columbia University Saint Mary’s University of Minnesota Embry Riddle University Virginia Polytechnic Institute Fermi National Accelerator Laboratory Western Illinois University Indiana University Yale University Thank you for your attention! Teppei Katori, Indiana University, PMN07
10. Back up Teppei Katori, Indiana University, PMN07
1. CCQE events in MiniBooNE Cut and efficiency summary Teppei Katori, Indiana University, PMN07
1. CCQE events in MiniBooNE Em m 12C n-beam cosq All kinematics are specified from 2 observables, muon energy Em and muon scattering angle q Energy of the neutrino En and 4-momentum transfer Q2 can be reconstructed by these 2 observables Teppei Katori, Indiana University, PMN07
3. CCQE data-MC comparison data-MC ratio from RFG model CCQE kinematics phase space The data-MC agreement is not great Since data-MC disagreements align on the Q2 lines, not En lines, the source of data-MC disagreement is not the neutrino beam prediction, but the neutrino cross section prediction. Teppei Katori, Indiana University, PMN07
3. CCQE data-MC comparison data-MC ratio from RFG model CCQE kinematics phase space The data-MC agreement is not great The data-MC disagreement is characterized by 2 features; (1) data deficit at low Q2 region (2) data excess at high Q2 region Teppei Katori, Indiana University, PMN07
3. CCQE data-MC comparison pz pz py py px px Pauli blocking parameter "kappa" : k To enhance the Pauli blocking at low Q2, we introduced a new parameter k, which is the scale factor of lower bound of nucleon sea and controls the size of nucleon phase space Ehi(fixed) This modification gives significant effect only at low Q2 region Elo(tuned) We tune the nuclear parameters in RFG model using Q2 distribution; MA = tuned PF = fixed EB = fixed k = tuned Teppei Katori, Indiana University, PMN07
3. CCQE data-MC comparison Q2 distribution with MA variation Q2 distribution with k variation MA and k are simultaneously fit to the data 2% change of k is sufficient to take account the data deficit at low Q2 region Teppei Katori, Indiana University, PMN07
4. Fit results Errors The detector model uncertainty dominates the error in MA The error on k is dominated by Q2 shape uncertainty of background events Teppei Katori, Indiana University, PMN07
4. Fit results • Least c2 fit for Q2 distribution • c2 = (data - MC)T (Mtotal)-1 (data - MC) c2 minimum is found by global scan of shape only fit with 0.0<Q2(GeV2)<1.0 The total output error matrix keep the correlation of Q2 bins Mtotal = M(p+ production) + M(p- production) + M(K+ production) + M(K0 production) + M(beam model) + M(cross section model) + M(detector model) + M(data statistics) Input error matrices keep the correlation of systematics dependent p+ production (8 parameters) p- production (8 parameters) K+ production (7 parameters) K0 production (9 parameters) beam model (8 parameters) cross section (20 parameters) detector model (39 parameters) independent Teppei Katori, Indiana University, PMN07
4. Fit results data-MC ratio after the fit MA - k fit result MA = 1.23 ± 0.20(stat+sys) k = 1.019 ± 0.011(stat+sys) Although fit is done in Q2 distribution, entire CCQE kinematics is improved before c2/dof = 79.5/53, P(c2) = 1% i after c2/dof = 45.1/53, P(c2) = 77% Teppei Katori, Indiana University, PMN07
4. Fit results Q2 distribution MA only fit result MA = 1.25 ± 0.12(stat+sys) fit with fixing k for 0.25<Q2(GeV2)<1.0 good agreement above 0.25GeV2 but gross disagreement at low Q2 region This fit cannot improve entire CCQE phase space Teppei Katori, Indiana University, PMN07
4. Fit results MA only fit result MA = 1.25 ± 0.12(stat+sys) data-MC ratio after the fit fit with fixing k for 0.25<Q2(GeV2)<1.0 good agreement above 0.25GeV2 but gross disagreement at low Q2 region This fit cannot improve entire CCQE phase space Teppei Katori, Indiana University, PMN07
4. Fit results MA(GeV2) 0.0 0.1 0.2 0.3 0.4 0.5(GeV2) k 1.50 1.050 1.25 1.025 1.00 1.000 0.0 0.1 0.2 0.3 0.4 0.5(GeV2) 0.6 0.4 c2 probability c2 probability 0.2 0.0 0.0 0.1 0.2 0.3 0.4 0.5(GeV2) Fit result with varying Q2min, Q2min < Q2 < 1.0GeV2 Fit is repeated with changing the Q2min Fit quality (c2 probability) is good even Q2min =0.0GeV2 MA is stable in wide range of Q2min Since k is only important for low Q2 region, it has no power for fit for high Q2 Teppei Katori, Indiana University, PMN07
4. Fit results 1.50 MA(GeV2) 1.25 1.00 0.0 0.1 0.2 0.3 0.4 0.5(GeV2) 0.6 c2 probability 0.4 0.2 0.0 0.0 0.1 0.2 0.3 0.4 0.5(GeV2) MA only fit with varying Q2min, Q2min < Q2 < 1.0GeV2 Fit is repeated with changing the Q2min Fit quality (c2 probability) is low for Q2min < 0.2GeV2 MA is stable in wide range of Q2min for Q2min > 0.2GeV2 Teppei Katori, Indiana University, PMN07
5. Anti-neutrino CCQE events Anti-neutrino Q2 distribution MiniBooNE anti-neutrino CCQE 8772 events (1651 total for pre-MiniBooNE data) We use same cut with neutrino mode The values of MA and k extracted from neutrino mode are employed to anti-neutrino MC, and they describe data Q2 distribution well. Anti-neutrino Q2 distribution data-MC ratio Preliminary Teppei Katori, Indiana University, PMN07