Download
1 / 1
40 likes | 322 Views
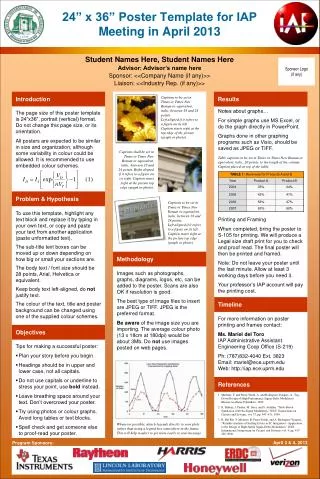
Poster Title Researchers ’ /Presenters ’ Names Department(s). Methods. Results. General formatting tips: Retain a border on the sides of the slide that is a minimum of 1/32” (this slide has 1/32” borders). Use at least an 18 point font . Dark text on a light background is most legible.

E N D
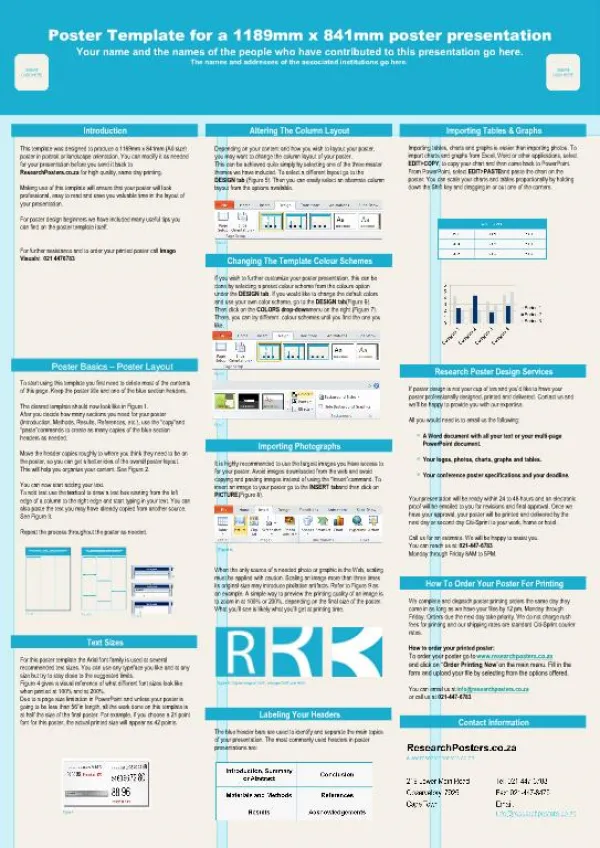
Poster TitleResearchers’/Presenters’ NamesDepartment(s) Methods Results General formatting tips: Retain a border on the sides of the slide that is a minimum of 1/32” (this slide has 1/32” borders). Use at least an 18 point font. Dark text on a light background is most legible. We suggest the sans-serif font “Arial”or the serif font “Time Roman” (not“Times New Roman”) Use the “Symbol” font for Greek characters. Copy and paste your text content here. Adjust the font size to fit. Adjust the text box size to fit. Tips for Excel Charts Copy and paste your Excel chart. The chart can be stretched to fit as required. If you need to edits parts of the chart, we recommend you edit the original chart in Excel, then re-paste the new chart.) (Delete this box when inserting your text or image. This is only a reminder.) Copy and paste your text content here. Adjust the font size to fit. Adjust the text box size to fit. Tips for Inserting Graphs or Images Note: Skip the following procedure if your graphs were created in PowerPoint®, Illustrator (eps file) or Excel. Image checking procedure: After you insert the image (72 dpi screen resolution) and resize to fit, right click on it and select Format Picture.) When the pop-up window comes up, click on size and check the scale. The image will display better if its width and height scale is at 25% or lower (20% or 10%, etc.) If the scale of the image is higher than 25%, try to replace it with a larger size (more dpi, e.g. 300dpi) image if possible. (Note: This should not be done by manually stretching the image to a larger size.) If the resolution of the image is 300 dpi or higher (400 or 600 dpi), then check to make sure its scale is not higher than 100%. To resize an image – Click on the image, hold the Shift key down and drag the bottom right corner to resize the image in proportion. (Delete this box when inserting your text or image. This is only a reminder.) Objectives Copy and paste your text content here. Adjust the font size to fit. Adjust the text box size to fit. Conclusions Copy and paste your text content here. Adjust the font size to fit. Adjust the text box size to fit. Tips for Title/Headers Bar Color How to change the background color for the poster title and headers: Right click on the bar and select Format Autoshape.) When the pop-up window comes up, select your color under “Fill” and then “Color” menu. For more effects select Fill Effects under the Color option. (Delete this box when inserting your text or image. This is only a reminder.) References • Journal Article, Name of Journal • Journal Article, Name of Journal • Journal Article, Name of Journal • Journal Article, Name of Journal • Formatting tip: references can be included using a 14 pt font to save space if needed for other sections of the poster. Printed by