Download
1 / 12
120 likes | 126 Views
This graphing exercise focuses on putting equations in slope-intercept form, graphing lines, determining if lines are solid or dashed, and shading above or below the y-intercept.

E N D
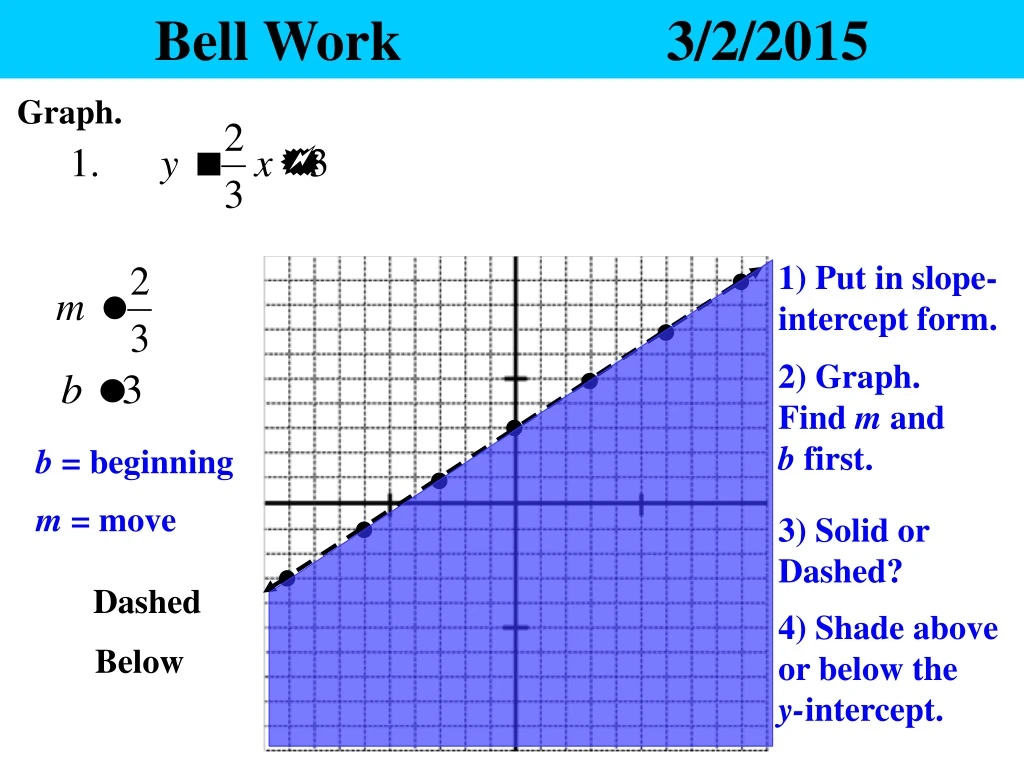
Bell Work 3/2/2015 Graph. 1) Put in slope-intercept form. 2) Graph. Find m and b first. b = beginning m = move 3) Solid or Dashed? Dashed 4) Shade above or below the y-intercept. Below
Yesterday’s Homework • Any questions? • Please pass your homework to the front. • Make sure the correct heading is on your paper. • Is your NAME on your paper? • Make sure the homework is 100% complete. • Incomplete work will NOT be accepted.
Heading 12/19/2019 Solving Systems of Linear Inequalities TSWBAT: solve a linear system of inequalities by graphing. Students solve a system of two linear equations in two variables algebraically and are able to interpret the answer graphically. Students are able to solve a system of two linear inequalities in two variables and to sketch the solution sets.
Notes • Steps to Graphing Linear System Inequalities • Write the equation in slope-intercept form. • Graph the y-intercept and slope. • Draw the line (solid or dashed). Dashed line Solid line 4. Lightly shade above or below the y-intercept. Above y-intercept Below y-intercept 5. Graph the other equation. 6. Darkly shade overlap.
Notes 1) Put in slope-intercept form. Graph the system of linear inequalities. Ex. Solid Below 2) Graph. Find m and b. 3) Solid or dashed? 4) Lightly shade above or below the y-intercept. Dashed 5) Do the same for the other equation. Above 6) Darkly shade overlap.
Notes 1) Put in slope-intercept form. Now you try. Graph the system of linear inequalities. Ex. Dashed Above 2) Graph. Find m and b. 3) Solid or dashed? 4) Lightly shade above or below the y-intercept. Dashed Above 5) Do the same for the other equation. 6) Darkly shade overlap.
Notes Graph the system of linear inequalities. Ex. Dashed Above Solid Below
Notes Now you try. Graph the system of linear inequalities. Ex. Solid Dashed Below Above
Summary • To solve a system of ______ inequalities first put both equations into slope-________ form. Next find the m and b and plot your points. Make a _____/dashed line and then shade above/______ according to the sign. Do the same for the other equation. Now darkly ______ the overlap. • linear • intercept • solid • below • shade
Today’s Homework • Rules for Homework • Pencil ONLY. • Must show all of your work. • NO WORK = NO CREDIT • Must attempt EVERY problem. • Always check your answers.
Homework 6.7 Graph the system of linear inequalities.
Ticket Out the Door • Complete the Ticket Out the Door without talking!!!!! • Talking = time after the bell! • Put your NAME on the paper. • When finished, turn your paper face DOWN. • Graph the system of linear inequalities.