Download
1 / 25
250 likes | 446 Views
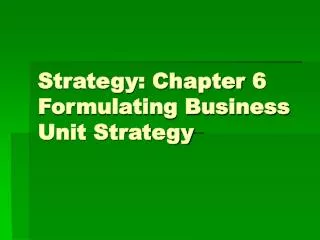
Chapter Five Crafting Business Strategy. OBJECTIVES. Define generic strategies and show how they relate to a firm’s strategic position. 1. Describe the drivers of low-cost, differentiation, and focus strategic positions . 2.

E N D
Chapter Five Crafting Business Strategy
OBJECTIVES Define generic strategies and show how they relate to a firm’s strategic position 1 Describe the drivers of low-cost, differentiation, and focus strategic positions 2 Identify and explain the risks associated with each generic strategy position 3 Show how different positions fit with various stages of the industry life cycle 4 5 Evaluate the quality of the firm’s strategy
STRATEGIC POSITIONING SHOULD IMPROVE PROFITABILITY Definition Where managers of a company situate that company relative to it’s rivals along important competitive dimensions Purpose To reduce the effects of rivalry and thereby improve profitability
1 Firm’s resources and capabilities 2 Industry structure A FIRM’S CHOICE OF POSITION DEPENDS ON TWO FACTORS
A FIRM CAN GAIN ADVANTAGE OVER RIVALS IN TWO WAYS Description No advantage overrivals Advantage over rivals Produce a differentiated product and charge suffici-ently higher prices to more than off-set the added costs of differentiation Differentiation Produce an essentially equivalent product at a lower cost Low-cost
THE STRATEGIC POSITIONING MODEL Broad(i.e., industry wide) Broad low-costleadership Broaddifferentiation Strategictarget Narrow(i.e., particular segment only) Focused costleadership Focuseddifferentiation Low-cost Differentiation Strategic advantage Adapted from poster, M.1980. Competitive strategy, 1980.
Low-cost leadership Differentiation • Capture market share by offering lower-price or • Earn higher by maintaining price parity • Capture market share by offering higher quality at same price or • Earn higher margins by raising prices over competitors Benefits • Pacific Cycle • Gallo Wines • Wal-Mart • Southwest Airlines • Home Depot • Trek Bicycles • Coca-Cola and Pepsi • Mercedez Benz • Honda, Yamaha, and Suzuki motorcycles • Stouffers (frozen foods) Examples LOW-COST LEADERSHIP AND DIFFERENTIATION OFFER GREATER MARKET SHARE AND/OR PROFITS
STRATEGIC POSITIONING EXAMPLES • Wal-Mart • Gallo Wines • Trek Bicycles • Coca-cola Broad Strategictarget • Montague • Mercedes Benz (in US) Narrow • Jet Blue Low-cost Differentiation Strategic advantage
2 Product cost Producer’s margin Buyer’s cost* LOW-COST AND DIFFERENTIATION CAN GENERATE HIGH MARGINS Price Hyundai has a cost advantage Hyundai Elantra Price Chevy Cavalier Price Honda has a differentiation advantage Honda Civic * Including maintenance and other intangibles
40 RESULTS OF DIFFERENTIATED, LOW-COST, AND INTEGRATED POSITIONS Industry average price Industry average cost Industry average competitor Successful differentiated competitor Successful low-cost competitor Competitor with both advantages (integrated) Price Cost
KEY DRIVERS OF COST ADVANTAGE • Economies of scale • Learning • Product technology • Product design • Location advantages for sourcing inputs
DISECONOMIES OF SCALE – SIZE DOES NOT ENSURE ECONOMIES OF SCALE Economiesof scale • Economies of scale exist during a period of time if the average total cost for a unit of production is lower at higher levels of output • You must review cost to assess whether economies of scale exist: • Fixed costs remain the same for different levels of production • Variable costs are the costs of variable inputs (such as raw materials and labor) and vary directly with output • Marginal cost is the cost of the last unit of production • Total cost is the sum of all production costs and always increases as output goes up • Average cost is the mean cost of total production during a given period (say, a year) Learning Economiesof scope Productiontechnology Productdesign Location
Some sourcesof economies Some sourcesof diseconomies • R&D spend • Advertising spend • Specialization of specific production processes • Superior inventory management • Purchasing power • Bureaucracy • High labor costs • Inefficient operations DISECONOMIES OF SCALE – SIZE DOES NOT ENSURE ECONOMIES OF SCALE Economiesof scale Learning Economiesof scope Productiontechnology Productdesign Location
MINIMUM EFFICIENT SCALE (MES) Average cost Economiesof scale Minimum efficient scale: The minimum scale needed to achieve maximum cost savings (i.e., minimum costs) Learning Economiesof scope Productiontechnology Productdesign Scale of operations Location Economiesof scale Diseconomies of scale
Costs decrease … Economiesof scale as the scale of operation increases during any given period of time Learning curve with the cumulative level of production since the production of the first unit LEARNING CURVE AS A SOURCE OF COST ADVANTAGE Economiesof scale How Learning Differs from Scale Learning Economiesof scope Productiontechnology Productdesign Location
LEARNING CURVE (continued) Step 1: Measure Economiesof scale Step 2: Calibrate No. of bikes produced Hours spent on last bike 1 2 4 8 16 32 64 128 30.00 actual 27.00 actual 24.30 actual 21.87 est. 19.68 est. 17.71 est. 15.92 est. 14.34 est. Learning Economiesof scope Productiontechnology Productdesign Step 3: Project Location
ECONOMIES OF SCOPE AS A SOURCE OF COST ADVANTAGE Economiesof scale If a firm produces two or more products and can share resources among two or more of these (e.g., share manufacturing machines) – thereby lowering the costs of each product – it benefits from economies of scope Learning Economiesof scope Productiontechnology Productdesign Location
PRODUCTION TECHNOLOGY AS A SOURCE OF COST ADVANTAGE Economiesof scale Often, a new entrant who wants to compete against industry incumbents with significant scale and experience advantages, tries to match or beat incumbents’ costs by introducing a production technology that is subject to different economics (e.g., Jet Blue, Nucor Steel) Learning Economiesof scope Productiontechnology Productdesign Location
PRODUCTION DESIGN AS A SOURCE OF COST ADVANTAGE Economiesof scale Learning Product design can sometimes be altered to lower a firm’s production costs (e.g., Canon vs. Xerox) Economiesof scope Productiontechnology Productdesign Location
LOCATION AS A SOURCE OF COST ADVANTAGE Economiesof scale Sometimes firms try to attain lower production costs by locating their operations in cheaper labor markets (e.g., Pacific Cycle manufactures in China and Taiwan to achieve lower costs than Trek who manufactures in the US) Learning Economiesof scope Productiontechnology Productdesign Location
To drive up customer’s willingness to pay and generate demand sufficient to • Premium brand image • Customization • Unique styling • Speed • More convenient access • Unusually high-quality • Recoup added costs and • Generate enough profits to make strategy worthwhile KEY DRIVERS OF DIFFERENTIATION ADVANTAGES Key Drivers Purpose
Drivers Threats • Economies of scale • Learning • Economies of scope • Superior technology • Product design • Location • New technology • Too low-quality • Social, political, and economic risks of outsourcing Low-cost • Premium brand image • Customization • Unique styling • Speed • Convenient access • Unusually high-quality • Failure to increase buyer’s willingness to pay higher prices • Under estimating cost of differentiation • Over fulfillment of buyer’s needs • Lower cost imitation Differentiation DRIVERS AND THREATS TO DIFFERENTIATION AND LOW-COST ADVANTAGE
STRATEGIES FOR DIFFERENT PHASES OF THE INDUSTRY LIFE CYCLE Phases of industry life cycle Embryonic Growth Mature Decline
1 Define generic strategies and show how they relate to a firm’s strategic position 2 Describe the drivers of low-cost, differen-tiation, and focus strategic positions 3 Identify and explain the risks associated with each generic strategy position 4 Show how different positions fit with various stages of the industry life cycle 5 Evaluate the quality of the firm’s strategy SUMMARY