Download
1 / 8
80 likes | 162 Views
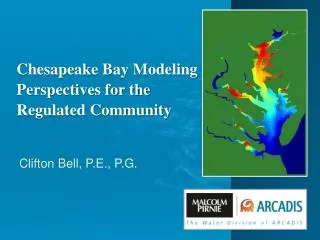
The Chesapeake Interactive Modeling Project. Jay Austin Large Lakes Observatory, U. Minnesota Duluth Jessica Crouch*, Mike Dinniman § , Yuzhong Shen*, John Klinck § , Elizabeth Smith § , Lee Belfore* Old Dominion University

E N D
The Chesapeake Interactive Modeling Project Jay Austin Large Lakes Observatory, U. Minnesota Duluth Jessica Crouch*, Mike Dinniman§, Yuzhong Shen*, John Klinck§, Elizabeth Smith§, Lee Belfore* Old Dominion University (§Center for Coastal Physical Oceanography; * Virginia Modeling and Simulation Center) Funded by the State of Virginia
Motivation • Numerical models play an ever increasing role in Oceanographic research • Most models are of such complexity that they are out of reach as teaching tools • At the same time, the basic concept of numerical modeling is an ideal paradigm for teaching
Target audiences • Formal education: K-12, undergraduate, and graduate education • Informal Education: Science museums • Resource managers
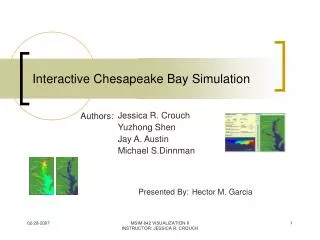
Method • Take a standard, open source numerical model and apply it to a particular system • Allow user to control forcing of model and data display through a Graphical Front End • Pare down model so that speed of execution is fast enough that casual user find it interesting, but still retains physical fidelity
Technical details • Numerical model: the Regional Ocean Modeling System (ROMS), available from the IMCS at Rutgers University. F90 code • 50x20 curvilinear masked grid, 10 vertical levels • Salt, no temperature • Tides imposed at offshore boundary • Allows user to modify wind field, freshwater flux • Allows user to choose V, S, sfc height, drifters • Front End: C++, using the Fast Light Toolkit
Why use a “real” model? • While this is a kludgy approach to the problem, it allows us greatest flexibility in the long run • Allows for porting of model to other geographic domains • Incorporation of submodels (biology, chemistry, sediments, etc) • Large user community
Future improvements • To Forcing: • Incorporate basic biological model • Incorporate land-use models • Port to different geographic regions • To output: • Allow user to place “moorings”, developing time series • Currently have proposal to SeaGrant to build “Modular” system