Download
1 / 20
200 likes | 280 Views
Learn about software reliability and availability engineering, including tactics for improving system availability and measuring system failures. Explore different failure categorizations and prioritize issues based on their impact on customers.

E N D
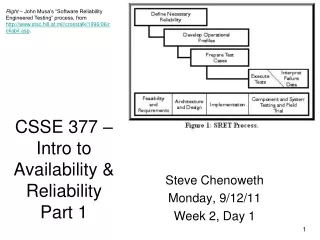
Right – John Musa’s “Software Reliability Engineered Testing” process, from http://www.stsc.hill.af.mil/crosstalk/1996/06/reliabil.asp. CSSE 377 – Intro to Availability & ReliabilityPart 1 Steve Chenoweth Monday, 9/12/11 Week 2, Day 1
Today • Team performance demos…from Fri, cntd • How to do Project 2! • Which is all about software availability engineering… • Bass’s Ch 4 (pp 79 - 80) and Ch 5 (pp 101 - 105) • For a whole lot more, see the following: • Software Reliability Engineering by John D. Musa. • Web site for Musa’s consulting business --http://www.stsc.hill.af.mil/crosstalk/1996/06/reliabil.asp. • “Software Reliability,” by Jiantao Pan, http://www.ece.cmu.edu/~koopman/des_s99/sw_reliability/. Musa
We next pick availability from Bass’s QA list… • Bass’s list of six, from the inside back cover of his book: • Availability • Modifiability • Performance • Security • Testability • Usability
And you here is a first project about it: • On the same system you’ve been working on, • Determine the availability this system – actually, of something specific about it, and • Implement a tactic to improve this by a designated amount! And a first step to take today: • Break down what your system “does” into an “operational profile.” • Decide what “availability of the current system” means, in some specific way. • Turn in, in your “team journal” by 11:55 PM tonight.
You now know… • You should pick something you can measure! • It should be supported by at least one “scenario” with measurable responses, as your arch targets • There’s more info in “The Notes” at the end of the supplementary spec template.
Bass’s avail scenarios • Source: Internal to the system; external to the system • Stimulus: Fault: omission, crash, timing, response • Artifact: System’s processors, communication channels, persistent storage, processes • Environment: Normal operation; degraded mode (i.e., fewer features, a fall back solution) • Response: System should detect event and do one or more of the following: • Record it • Notify appropriate parties, including the user and other systems • Disable sources of events that cause fault or failure according to defined rules • Be unavailable for a prespecified interval, where interval depends on criticality of system • Response Measure: • Time interval when the system must be available • Availability time • Time interval in which system can be in degraded mode • Repair time
Example scenario • Source: External to the system • Stimulus: Unanticipated message • Artifact: Process • Environment: Normal operation • Response: Inform operator continue to operate • Response Measure: No downtime
Let’s do some basics… • Failures vs faults • Failures are observable, have some impact • Reliability vs availability • Reliability measures the ability of a system to function continuously without interruptions. Like, a mean time to failure of 1 year. • Availability also considers mean time to repair:
On your projects… • Reliability is a bit easier to measure • Just start a stopwatch and run it till it crashes? • Or, until the user notices something wrong? • To calculate availability, you need to consider what “fixing it” means -- either • Restarting the system is the “fix” time, or • Actually fixing the bug that caused the crash!
Different views of “reliability” • Does the system have to be flat on the floor to count a “failure”? Or, • Do you count it if it just does some arithmetic wrong? Or, say, • The cursor disappears at the bottom of a page (as used to happen on MS-Word)? • Solution – Make different “severities” and “priorities” of errors for running systems, as in testing. Image from divisbyzero.com/2009/02/02/clearance-price-fail/ .
Sample categorization of failures Severity: • High: A major issue where a large piece of functionality or major system component is completely broken. There is no workaround and operation (or testing) cannot continue. • Medium: A major issue where a large piece of functionality or major system component is not working properly. There is a workaround, however, and operation (or testing) can continue. • Low: A minor issue that imposes some loss of functionality, but for which there is an acceptable and easily reproducible workaround. Operation (or testing) can proceed without interruption. Priority: • High: This has a major impact on the customer. This must be fixed immediately. • Medium: This has a major impact on the customer. The problem should be fixed before release of the current version in development, or a patch must be issued if possible. • Low: This has a minor impact on the customer. The flaw should be fixed if there is time, but it can be deferred until the next release. From http://www.stickyminds.com/sitewide.asp?Function=edetail&ObjectType=ART&ObjectId=3224.
Then… • Someone must define how things like “reliability” are measured, in these terms. Like, • “Reliability of this system = Frequency of high severity failures.” Blue screen of death…
Let’s look at Musa’s process • Based on being able to measure things, to create tests. • New terminology: “Operational profile”…
Operational profile • It’s a quantitative way to characterize how a system will be used. • Like, what’s the mix of the scenarios describing separate activities your system does? • Often built up from statistics on the mix of activities done by individual users or customers • But the pattern of usage also varies over time…
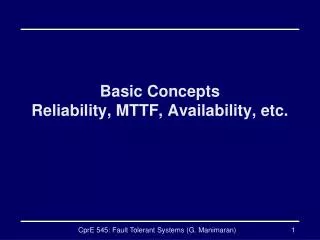
An operational profile over time… a DB server for online & other business activity
Here’s a view of an Operational Profile over time and from “events” in that time. The QA scenarios fit in the cycle of a company’s operations (in this case, a telephone company) Legend: NEs -- Network Elements (like Routers and Switches) EMSs -- (Network) Element Management Systems, which check how the NE’s are working, mostly automatically OSs -- Operations Systems – higher level management, using people FIT – Failures in Time, the rate of system errors, 109/MTBF, where MTBF = Mean Time Between Failures (in hours). Customer care calls -- Problems & Maintenance Service provider users Subscribers OSs traffic Clock EMSs All busy hour customer care calls traffic scheduled activity Customer site equipment NEs Environment { NEs EMSs OSs Service provider Customer site staff affect Disasters, backhoes FIT rates Network expansion stimuli -- New business / residential development New technology deployment plans
On your system… • The operational profile should at least define what a typical user does with it • Which activities • How much or how often • And “what happens to it” – like “backhoes” • Which should help you decide how to stress it out, to see if it breaks, etc. • Typically this is done by rigging up “stimulator” - a test which fires random data values at the system, a high volume of these. “Hey – Is that a cable of some kind down there?” Picture from eddiepatin.com/HEO/nsc.html .
Project 2 – Avail / Rel • It’s out on the course web site, under Projects. • To turn in tonight: • What’s the operational profile for your system? (A table, like Slide 16.) • What “improvement opportunity” are you going to try for? (See Project 2.) • E.g., Where / how can you try to break it, then figure out where to fix it?
Last but not least… Tomorrow – second half of the hour • Biweekly Quiz 1 - What will it be like? • 10 short answer questions – mostly applying your knowledge • A couple calculations, like on a performance spreadsheet, or figuring availability • Should know how to write Bass-style “scenarios” – like on Slides 6-7 of this set • What will be on it? • Everything discussed through today – see lectures • Bass Ch 1-3, plus • Ch 4-5 parts on performance and availability • Prior year examples (there’s one on the course web site, under Quizzes): • What kinds of knowledge do you add to the reference architecture to make it specific enough to actually “work” as the design of your system? • The cooperating sequential processes of the planned OO software for the A-7E did not use threads because they expected to have multiple processors. Explain what they meant by this, and discuss whether that really made the software simpler: • The following definition of software architecture is due to Nathan Sowatskey (Technical Leader, Cisco, Madrid, Spain): • “A software architecture is the means by which the structure of a system is organized so as to reduce the costs and complexity associated with developing and supporting it.” Critique this definition in terms of Bass’s definition, as to what it adds and what it leaves out: • Before the quiz – We’ll talk about tactics for availability (from Bass Ch 5)