Download
1 / 42
420 likes | 721 Views
Observation of reduction in Casimir Force Without Change of Dielectric Permittivity (?) U. Mohideen University of California-Riverside. Motivation to measure Casimir force with Indium Tin Oxide (ITO). Use Transparent Electrodes to Reduce the Casimir Force

E N D
Observation of reduction in Casimir Force Without Change of Dielectric Permittivity (?)U. MohideenUniversity of California-Riverside
Motivation to measure Casimir force with Indium Tin Oxide (ITO) • Use Transparent Electrodes to Reduce the Casimir Force • Manipulation of the Casimir Force using UV Light • Explore same puzzles in the Lifshitz Theory with dielectrics
Transparent Electrodes to Reduce Casimir Force Rationale: Reduce Casimir Force by Reducing Boundary Reflectivity at characteristic frequency (~c/2z) z In devices z~ 1mm Gold Electrodes have ~100% Reflectivity Use electrodes which are transparent around 1mm to reduce reflectivity and reduce Casimir force De Mann et al, PRL, 103,040402 (2009)
UV treatment to Reduce Casimir Force (?) Rationale: UV treatment known to change mobility of Charge Carriers in ITO C.N. Li et al, Appl Phys. , 80,301 (2005)
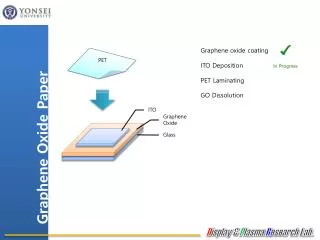
ITO Sample Properties • Sputter coated ITO film made in a loadlocked and cryo-pumped system with a base pressure of 5X10⁻⁷Torr or better. • The substrates (Quartz) are sputter etched cleaned and then sputter coated with ITO on one side. • The resistivity of ITO taking by four point probe measurement is 42 ohms/sq. • The thickness of ITO measured by AFM is 74.6 ± 0.2nm
EXPERIMENT Compare the Casimir force using Au & ITO Plates (with and without UV Treatment) Experiment: i. Measure Casimir force between Au Sphere and Au plate ii.ReplaceAu plate with ITO plate Compare iii. UV Treat ITO plate and Measure Casimir Force Compare Results: 1.Casimir force reduces by x 2 with ITO 2.Casimir Force reduces additional ~35% with UV treatment
Force Measurements Using Cantilever Deflection Plate :Au or ITO Radius of Au coated Sphere= 101.23±0.25 µm Smooth Au coating 0f 105±1 nm 10 nm Cr followed by 20 nm of Al then Au coating Au Coating done at 3.75 Ẩ/min
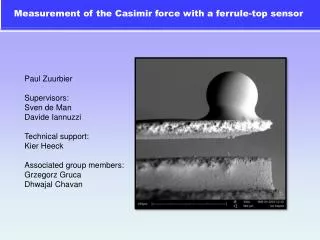
Experimental set-up scheme for contact mode Oil Free vacuum at 10-7 Torr Temperature 2 o C Vibration Isolation
Method: Measured Total Force(Electrostatic+Casimir) between Au Sphere and ITO Plate Cantileverdeflection signal: Electric Force 10 Different Voltages V Vo = Residual Potential X(z)~ Capacitance k’ = cantilever spring constant Parabolas Drawn at each Separation
Residual Electrostatic Potential between Au Sphere and ITO Plate <V0>=-196.81.5 mV Residual Voltage independent of Au Sphere-ITO plate separation This allows easy subtraction of the electrostatic force
Experimental Procedure Cantileverdeflection signal: z=z0+ zpiezo-Sphotodiode signal * m Parameters defined from parabolas: m from z0 = Surface separation on contact m= cantilever deflection per signal unit Use sphere- plate electrostatic formula - residual potential difference between the sphere and the plate - Curvature
Determination of contact separation zo & cantilever spring constant k <z0>=29.50.4 nm <k>=0.01390.0001 N/m Both zo & k independent of separation Critical for precision measurement
Correction for Sphere or Plate Movement during Measurement Will lead to Dependence of Vo on Separation Distance (AnamalousBehaviour Due to Skewed Parabola) Force vs. Separation Curves for Same Applied Voltage Shifted due to Sphere/Plate Movement 1st time 0 2nd time Cantilever Deflection Sphere- Plate separation (nm)
Correction due to Sphere-Plate Drift 1. Find Precise Sphere Plate Contact Point- Extrapolate 2. Repeat Electrostatic Force Measurement for same applied V and look at change in contact point. 0.08 nm/sec Contact points as a function of time
Errors due to Sphere-Plate Separation Drift Corrected Uncorrected <V0>=-196.81.5 mV <z0>=29.50.4 nm
Measured Casimir Force from Au Sphere- ITO Plate Subtract Electric Force from Total Force 100 Voltages Applied to Plate
Measured Casimir Force Comparison of Au plate to ITO plate Number of voltages V = 10 Number of repetitions = 10 z (nm) FCas (pN) ITO/Au 85 -123.42 0.57 100 -81.62 0.61 120 -50.1 0.59 40% Reduction in Casimir Force with ITO
UV Treatment of ITO Plate • Penray Hg Lamp 9.0 inch long and 0.375 inch diameter • λ=254 nm 5.4 mWatt/cm2 at 1.9 cm • λ=365 nm 0.2 mWatt/cm2 at 1.9 cm • 12 hr • Cleaned as before (Acetone, Methanol, Ethanol, water rinse and Nitrogen dry)
Insert UV Treated ITO Plate & Repeat Measurement
Measured Total Force(Electrostatic+Casimir) between Au Sphere and ITO Plate Cantileverdeflection signal: Electric Force 10 Different Voltages V on plate Vo = Residual Potential X(z)= Capacitance k’ = cantilever spring constant Use sphere- plate electrostatic formula - residual potential difference between the sphere and the plate Parabola Curvature
Check Stability of Measurements of Au Sphere and ITO Plate (after UV treatment) Fit Electrostatic Force Curve <V0>=65 2 mV Distance independence of residual potential Vo 2. Distance independence of contact separation zo 3. Distance independence of Spring constant <z0>=290.6 nm <k>=0.01380.0001 N/m
Repeat Casimir Force between Au Sphere and ITO Plate (after UV treatment) Subtract Electric Force from Total Force 100 Voltages Applied to Plate Grey Bars represent the complete range of data every 5 nm
Casimir Force between Au Sphere and ITO Plate (Before and After UV comparison) After UV/Before UV z (nm) 85 0.72 100 0.68 21-35% Reduction with UV treatment 21% at 60 nm and 35% at 130 nm 120 0.66
Histograms of the Experimental Data - No Overlap ITO After UV ITO Before UV 60 nm 80 nm 100 nm
Experimental Errors at 95% Confidence Level ITO Before UV ITO After UV Error due to use of Proximity Force Approx <0.3% Radius of Sphere= 101.2±0.5 mm
R>>z R z Lifshitz Formula 1 2 Reflection Coeffs: Matsubara Freqs. At l=0, x=0
Measure Permittivity Ellipsometry Measurements J.A. Woollam Co., Inc. VUV-VASE Spectral range 0.14 – 1.7 µm; Angle of incidence is computer controlled from 10° to 90° ; IR-VASE Spectral range 1.7–33 µm; Angle of incidence is computer controlled from 30° to 90°.
Comparison with Theory: Casimir Force between Au Sphere and ITO Plate Dielectric Permittivity Measured by Ellipsometry from 0.04 eV to 8.47 eV. Fit to Lorentz oscillators and Drude type free electron behavior aA=111.52; w0=8.eV, g0= 4.eV. Extrapolated to lower Frequency with Drude Model [wp=1.5 eV, g=0.128 eV]
Dielectric Permittivity in Imaginary Frequency No UV After UV Drude Model Parameters [wp=1.5 eV, g=0.128 eV (No UV), g=0.132 eV (UV)] aA=111.52; w0=8.eV, g0= 4.eV; aA=240.54, w0=9.eV, g0=8.5eV. Very Little Difference between Before and After UV in imaginary frequency
ITO Plate Roughness Fractions vi of the surface area covered by roughness with heights hi RMS Roughness=2.04 nm Roughness effect <0.5 % for >116 nm <1% for > 90 nm <2.2% at 60 nm
Carrier Density Measurement No UV After UV wikipedia Slope = B/dne is same Same Carrier Density = 7 x 10²⁰ /cc
Comparison with Theory: Casimir Force between Au Sphere and ITO Plate Before UV ITO Before UV DC Conductivty Included – Good Agreement
Comparison with Theory: Casimir Force between Au Sphere and ITO Plate After UV ++ Data ----Theory with DC Conductivity Effect of inclusion of DC Conductivity No Agreement if we include Free Carriers ITO After UV
Comparison with Theory: Casimir Force between Au Sphere and ITO Plate After UV DC Conductivity Not Inclduded Good Agreement only if we drop the DC conductivity of ITO Afer UV Assume it to be a perfect dielectric ITO After UV
Electrostatic simulation with COMSOL software package 0r V=0 r – relative permittivity Aeff=2Rd - We solved the Poisson equation for conductive plate (variable potential Vplate) with dielectric patches on the surface (random potential distribution in [-90;90] mV) and conductive sphere on the distance z from the plate Ftotal (Vplate) between the sphere and plate = 0 Vplate =V0 Patches Plate size = 32×32 m; Patch size = 0.6×0.6 m; Vplate=0.018 mV , Vsphere=0, Vpatches=random in [-90;90] mV, ~0.7 mV. Area filled by patches has been chosen according to condition: Surface area > Aeff=2Rd (for z=0.1 m plate size should be higher then 8 m)
Electrostatic simulation with COMSOL software package 0r V=0 Aeff=2Rd - r – relative permittivity We solved the Poisson equation for conductive plate (variable potential Vplate) with dielectric patches on the surface (random potential distribution in [-90;90] mV) and conductive sphere on the distance d from the plate In the pictures: Sphere radius R = 100 m; Plate size = 32×32 m; Patch size = 0.3×0.3 m to 0.9×0.9 m; Vpatches=random in [-90;90] mV, ~0.7 mV. Patches Sphere Plate Apply voltages to the plate and find voltage when electrostatic force goes to zero This compensating voltage (Vo) is found for different separations.
Simulation Results of Compensating Voltage Distance Independent As in Observed in Experiment –Well Compensated
Conclusions • UV Modification of the Casimir Force was demonstrated. • No Anamalous distance dependence of the Compensating Voltage • 21-35% reduction of Casimir force by UV treatment even though there is not much change in e(ix) • The Casimir force measurements have the correct distance dependence. • Inclusion of DC conductivity in the Lifshitz formula for the ITO after UV leads to disagreement with the experimental results. • A Study of the Temperature Dependence of the Carrier Mobility might shed light on the discrepancy. • Precision Measurement of Casimir Force with Au Using a Dynamic AFM at 15:30 pm
Acknowledgements Experiment C.C. Chang • Banishev R. Castillo Theoretical Analysis V.M. Mostepanenko G.L. Klimchitskaya Research Funded by: DARPA, National Science Foundation & US Department of Energy
Comparison with Theory: Casimir Force between Au Sphere and ITO Plate ITO Before UV ITO After UV Comparison DC Conductivty Included DC Conductivity Not Inclduded Good Agreement only if we dropthe DC conductivity of ITO Afer UV