Download
1 / 51
510 likes | 609 Views
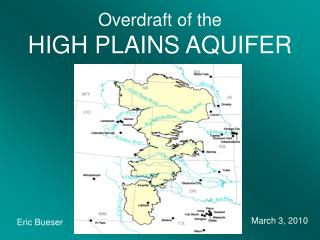
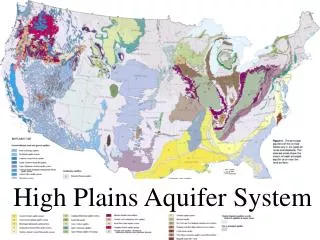
Overview and Issues of the High Plains Aquifer, Oklahoma, 2010. Mark F. Becker U.S. Geological Survey Oklahoma City, Oklahoma. Outline of Presentation. Issues (addressed throughout presentation) Location and Setting Oklahoma Water Law Hydrology and Water-Quality

E N D
Overview and Issues of the High Plains Aquifer, Oklahoma, 2010 Mark F. Becker U.S. Geological SurveyOklahoma City, Oklahoma
Outline of Presentation • Issues (addressed throughout presentation) • Location and Setting • Oklahoma Water Law • Hydrology and Water-Quality • Water-Uses and Effects of Withdrawal • Future of Irrigated Agriculture • Conclusions
Issues • Long way from State Capitol • Sparsely Populated (Small Legislative Representation) • Oklahoma Water Law • Groundwater Level Declines • Future for Irrigation
Issue # 2: Sparse Population Colorado Estimated Population of Panhandle in 2009 was 30,035 Kansas Oklahoma New Mexico Texas
Setting • Overlies approximately 7,100 mi2 in Oklahoma • Texas County is Largest Ag Producer in OK • Mean annual precipitation around 19-in/yr • Temperature range: -25o F to +110o F • Average lake evaporation = 62-in/year • Average runoff (pre-1970) = 0.2-in/year
Land Use (Oklahoma Portion) • 56% rangeland • 40% dry cropland • 4% irrigated cropland
Harvested Acres (Oklahoma Portion) • Wheat 2,600,000 acres • Corn 800,000 • Sorghum 700,000 • Hay 300,000 • Other 65,000
Livestock (Oklahoma High Plains) • 620,000 cattle in 1992 • 750,000 cattle in 1997 • 20,000 swine in 1992 • > 2,700,000 in 1999
Issue #3: Oklahoma Water Law • Oklahoma has a “mining” based regulatory approach to groundwater • Property Right • Allows for depletion over time • Allocations are for high capacity wells and until determined set at 2 acre-ft/ac/yr for land owned • Does not recognize hydraulic connection to surface water • No effective monitoring • Kansas has highly regulated sustainable based law • Texas has essentially no jurisdiction over groundwater
Hydrogeology • Series of coalescing alluvial fans consisting of sand, clay, and gravel that can exceed 500’ in thickness • Well yields can exceed 2,000 GPM • Direction of groundwater flow is from west to east • Recharge is distributed • Recharge is relatively rapid • Water-level declines from irrigation withdrawals
Center-pivot Irrigation began in the early 1960’s in Oklahoma
Center Pivot Technology Changed Irrigation Practices • Land with rolling topography could be irrigated • Circles are 0.5 mile in diameter • Each well pumps about 1,500 gpm
Percent Ground-Water Use in the Central High Plains in 1992 Percent Water Use
Water Use in 2005 252Mgal/d
Saturated Thickness (1998) 50-100 >300 <50 100-300
Issue #4: Water-Level Declines • Long-term effects on streamflow • Ecosystems • Treated municipal wastewater • Increased pumping costs • Potentially reduces irrigated agricultural opportunities • Creates acrimony (whiskey’s for drinking, water’s for fighting)
Water-Level Changes to 1980 Declines more than 100 feet in Kansas, Oklahoma, and Texas Declines of 10-50 feet widespread Rises more than 25 feet in Nebraska Large areas of little on no change
Water-Level Changes to 1997 Areas of declines have expanded Areas of rises have expanded, especially in Texas and Oklahoma Large rises in Nebraska continue
Water-Level Change from Predevelopment to 1998 25-50 >50 • ± 10 Rise 10-25
A Lesson in Planning: The Beaver/North Canadian River Basin Near Guymon 07232500 Optima Lake At Beaver 07234000 At Woodward 07237500 Well Canton Lake Near Seiling 07238000 Stream Gaging Station Ground Water Well
Upstream face of Optima Dam in 1990 Aerial Photo by Dale Boyle, U.S. Geological Survey
Increases in Numbers of Large-Capacity Irrigation Wells in the Oklahoma Panhandle
Depth to Water in a key Oklahoma Well in the High Plains Aquifer
Percentage of no-flow days for theBeaver River near Guymon, Okla.
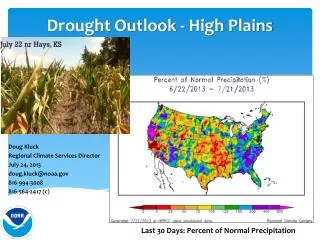
Annual Precipitation (bars) and 10-year moving average (line) for western Oklahoma
Annual flow volume (bars) and 10-year moving average (line) near Guymon (07232500)
Annual Peak Discharge (bars) and 10-year moving average (line) near Guymon, OK (07232500)
Recharge • Myth #1: Recharge comes from snowmelt in the Rockies • Myth#2: Aquifer receives little or no recharge • Reality: Distributed recharge from precipitation
Estimated Depth to Water in Feet Tritium Units
DeuteriumVSMOW ‰ 18O/16OVSMOW ‰
Predevelopment Recharge • 4.0% of precipitation in sand-dune areas. Averaged 0.69 inches per year. 139,000 acre-feet per year. 14% of model area. • 0.37% of precipitation in other areas. Averaged 0.07 inches per year. 85,000 acre-feet per year. 86% of model area.
Cultivated Dryland Recharge • Extra recharge due to dryland cultivation • 3.9% of precipitation over area in dryland; about 0.65 inches per year • 345,000 acre-feet per year
Dryland Recharge 30 Depth to Water 40 50 1940 1990
Issue # 5: Future of Irrigation • Tied to prices of fuel and crops • New technologies allow exploitation of lower well yields • Genetically modified crops • Low/No Till methods • Economy of scale; larger farms, less farmers
Conclusion • Politically, not well represented but recognized by the economic value. • Contrasting water management strategies on borders • Declines in water levels • Increased costs • Loss of surface water • Potential for technological advances to keep irrigated agriculture a component
Conclusions • NO3 is elevated in most wells • NO3 is found at all well depths • 15N indicates the presence of animal wastes • Changes ahead as more data is evaluated
OWRB Data NO2 + NO3mg/L as N Estimated Depth to Water in Feet
Animal 15NAir ‰ Mixed Animal, Fertilizer, or Soil Fertilizer NO2 + NO3 mg/L as N
Types of Water-Quality Data (OWRB) • Field measurements (temperature, pH, alkalinity, O2, specific conductance) • Chemical analyses (common ions, metals, nutrients, 15N, 18O, and deuterium) • Age dating (tritium, tritium/helium, and 14C)
Kansas Sub Unit Survey Reconnaissance Public Supply Colorado Oklahoma New Mexico Texas Location of Central High Plains NAWQA Study Area
Tritium NO2 + NO3 mg/L as N
Water-quality Data Collected in 1999 • Oklahoma water resources board (OWRB)- 12 Wells • NAWQA Sub Unit Surveys- 94 wells • NAWQA Regional Transect - 5 well clusters (15 Wells) • NAWQA reconnaissance - 5 wells • NAWQA Public Supply Survey- 15 wells
Outline of Presentation • Describe Oklahoma setting and similarities to the entire Central High Plains • Describe Oklahoma High Plains study and High Plains NAWQA • Water-quality in Oklahoma High Plains • Conclusions