Download
1 / 26
260 likes | 373 Views
How Markets Fared this Summer and What to Expect in 2007. IEP 25 th Annual Meeting October 9, 2006 Steve McClary MRW & Associates, Inc. Oakland, California mrw@mrwassoc.com. Overview. Heat Storm 2006 How Demand Was Met Looking Ahead to 2007 Conclusions. Heat Storm 2006.

E N D
How Markets Fared this SummerandWhat to Expect in 2007 IEP 25th Annual Meeting October 9, 2006 Steve McClary MRW & Associates, Inc. Oakland, California mrw@mrwassoc.com
Overview • Heat Storm 2006 • How Demand Was Met • Looking Ahead to 2007 • Conclusions
July 2006 California Heat Storm CAISO Area Weighted Average Summer Temperatures • Normal summer (1-in-2) is 89° • Extreme summer (1-in-10) is 102° • July 2006 was 106°-110° Definitions: Summer is the period June 15-September 15. Weighted average temperatures are from a set of representative weather stations.
Heat Storm was Long and Intense • Extraordinary minimum and average temperatures in July • Minimum temperatures significantly above normal in some areas • Livermore: 24° above normal; Fresno: 23° above normal • Hottest overnight lows ever recorded at about half of the NOAA recording stations • Fresno: 90°; Stockton: 82°; San Jose: 74° • For June 15-July 27: actual temperatures 3 standard deviations above weighted maximum average temperatures in the CAISO control area • Duration of high temperatures contributed to heat storm • Valley heat wave persisted for 36 days • Sacramento recorded 11 consecutive days of 100+ temperatures • Humidity was a factor • SDG&E estimates humidity combined with high temperatures added 4%-6% additional load during July 22-24
Historical Heat Waves: 1949-2006 Top Eight Heat Waves in PG&E Service Area Source: PG&E Presentation, “July 2006 Heat Wave (Heat Storm) PG&E Area”
Temperatures & Peak Loads: July 17-27 Mission Viejo soccer tournament July 24 peak: 50,270 MW Temperatures in IOUs’ Areas Peak Load in CAISO Area Source: California Energy Commission, July 2006 Heat Storm Workshop, August 29, 2006; http://www.energy.ca.gov/2006_summer_outlook/documents/index.html
Peak: Temperature + Load Growth • CAISO 2006 peak almost 5,000 MW higher than 2005 • Total CAISO load year to date is 5% higher than 2005 • Adjusted to account for MID and TID departure • Load continues to grow • Higher energy use per customer • Significant growth in air conditioning use • Heat caused loss of A/C load diversity
Customer and Infrastructure Impacts • 138 deaths attributed to heat storm conditions • Distribution transformers failed • Extreme conditions meant loss of A/C cycling diversity; high load factors on distribution system • Ambient temperatures were critical contributing factor to transformer failures • Age of transformers only a minor factor in failure
Demand Forecast Performance 1,500 MW Demand forecasts for CAISO control area
How Demand Was Met
Customers Cut Their Own Demand State government led by example • 25% reduction in state buildings • Strong public response to conservation requests • Flex Your Power: “Flex Alerts” issued only when high temperatures were expected • Utilities’ customer outreach efforts • PG&E estimated 500 MW reduction in its territory • Interruptible and demand response customers provided 850 MW
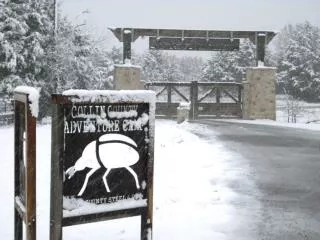
Coordination by Market Participants • Water districts • Reduced peak pumping load • Returned load gradually at PG&E request • Generators • Maintenance schedules were optimized • Coordination on imports • Exceeded normal transmission limits from Northwest; “sharpened the pencils” • BPA sent water down river on Sunday to maximize Monday generation • Modified generator maintenance schedules • CAISO summer preparedness training for transmission system operators • Firefighters protected grid from wildfires
High Generator Availability • Less than 1,000 MW of uncommitted capacity during peak hours in late July • Scheduled and forced outages less than 2,500 MW on July 24 • Below 3,000 MW for most of July • Resource adequacy requirements were instrumental • 95% of overall peak scheduled day-ahead; 99% scheduled hour-ahead • SDG&E reported mixed performance for peakers in its territory
Additional Factors • Imports provided 9,600 MW • Hydro resources were abundant • Blown transformers reduced load by about 200 MW • Transmission line availability was high • Transmission congestion was not an issue
Electricity Demand Continues to Grow… • CEC’s 2007 forecast: 1-2% growth • CAISO expects weather-adjusted increase of about 1,000 MW per year • Under expected conditions (1-in-2), CEC forecasts an operating reserve margin of 21% • Reserve margin drops to 5.5% for 1-in-10 • Reserve margin under Heat Storm 2007?
…But New Infrastructure Several Years Out • High probability generation additions • 2007: 190 MW1 • 2008: 752 MW • CAISO has interconnection requests for 29,150 MW covering next five years; expects less than 50% to reach commercial operation • New major transmission lines • SCE’s Devers-Palo Verde 2 planned for late 2009 • SDG&E’s Sunrise Powerlink planned for 2010 1 Source: WECC Proposed Generation Database, posted on the CEC website. This number does not include the peaking capacity the IOUs have proposed in response to CPUC Pres. Peevey’s ruling.
Fast-Track Measures for 2007 • IOUs seek to add new peaking capacity • SCE: utility-built 250 MW • PG&E: utility-built 200 MW + San Francisco peakers + power purchases • SDG&E: 250 MW in-basin through power purchases • Expanded demand response programs • IOUs proposing extra 679 MW for 2007 • A/C cycling, demand bidding, AutoDR • Requested expedited regulatory approval
Regulatory and Planning Issues • Resource adequacy requirements • Should 15% planning margin be based on 1-in-2 demand? 1-in-10? • Consideration of IOU-specific circumstances • Hydroelectric capacity • Large single contingency relative to system (e.g., SDG&E) • Potential for multi-year adequacy requirements • Need 3-10 year forecast of requirements for development • Forecasting • CEC needs data from IOUs sooner to provide forecasts earlier • Include humidity factors in forecasts
Lucky or Well-Prepared? • Well-prepared • Coordination among key market players • High generator availability: additional resources would not have prevented outages; transformers were the weak link • Strong customer response • Lucky • Excellent hydro conditions • No wildfires threatening grid • Transmission congestion not an issue
Implications for Future Planning • Summer 2006 was (or should be) wake-up call for state planners and SCE • Climate change could be a wildcard in future energy forecasts • The CEC identified resource needs in the 2005 IEPR (not additive) • Total Procurement Need for 2009 • SCE: 8,724 MW • PG&E: 5,001 MW • SDG&E: 305 MW • Additional Renewables by 2010 • SCE: 1,183 MW • PG&E: 790 MW • SDG&E: 428 MW • Aging Plant Replacement by 2012 • SCE: 8,088 MW • PG&E: 4,900 MW • SDG&E: 1,619 MW